I still remember the days when it was common to include database query details and page render times in the footer of PHP sites. They were a badge of technical prowess. They screamed complexity. They let everyone know how dynamic the site had become.

Performance wasn’t given much of a thought and as long as your pages rendered reasonably quickly, things were good. Most never noticed these footers. If they did, there was little they could do with the information. It wasn’t long before these vanished from site footers, into HTML comments at the end of the page. Web development has moved on and I struggled to find an example of this practice used today.
	<!--
		page generation: 0.53s
		queries: 57
	-->
</html>
Performance has traditionally been the domain of the back-end engineer. But as we ask more of our browsers and understand more about how performance affects user experience, front-end developers have had an increasing if not dominant role to play in performance engineering. It is no accident that browser tools such as the DevConsole have come a long way in providing front-end engineers with deep insight into the performance of their code.
Take this simple view showing the performance of a simple test page.
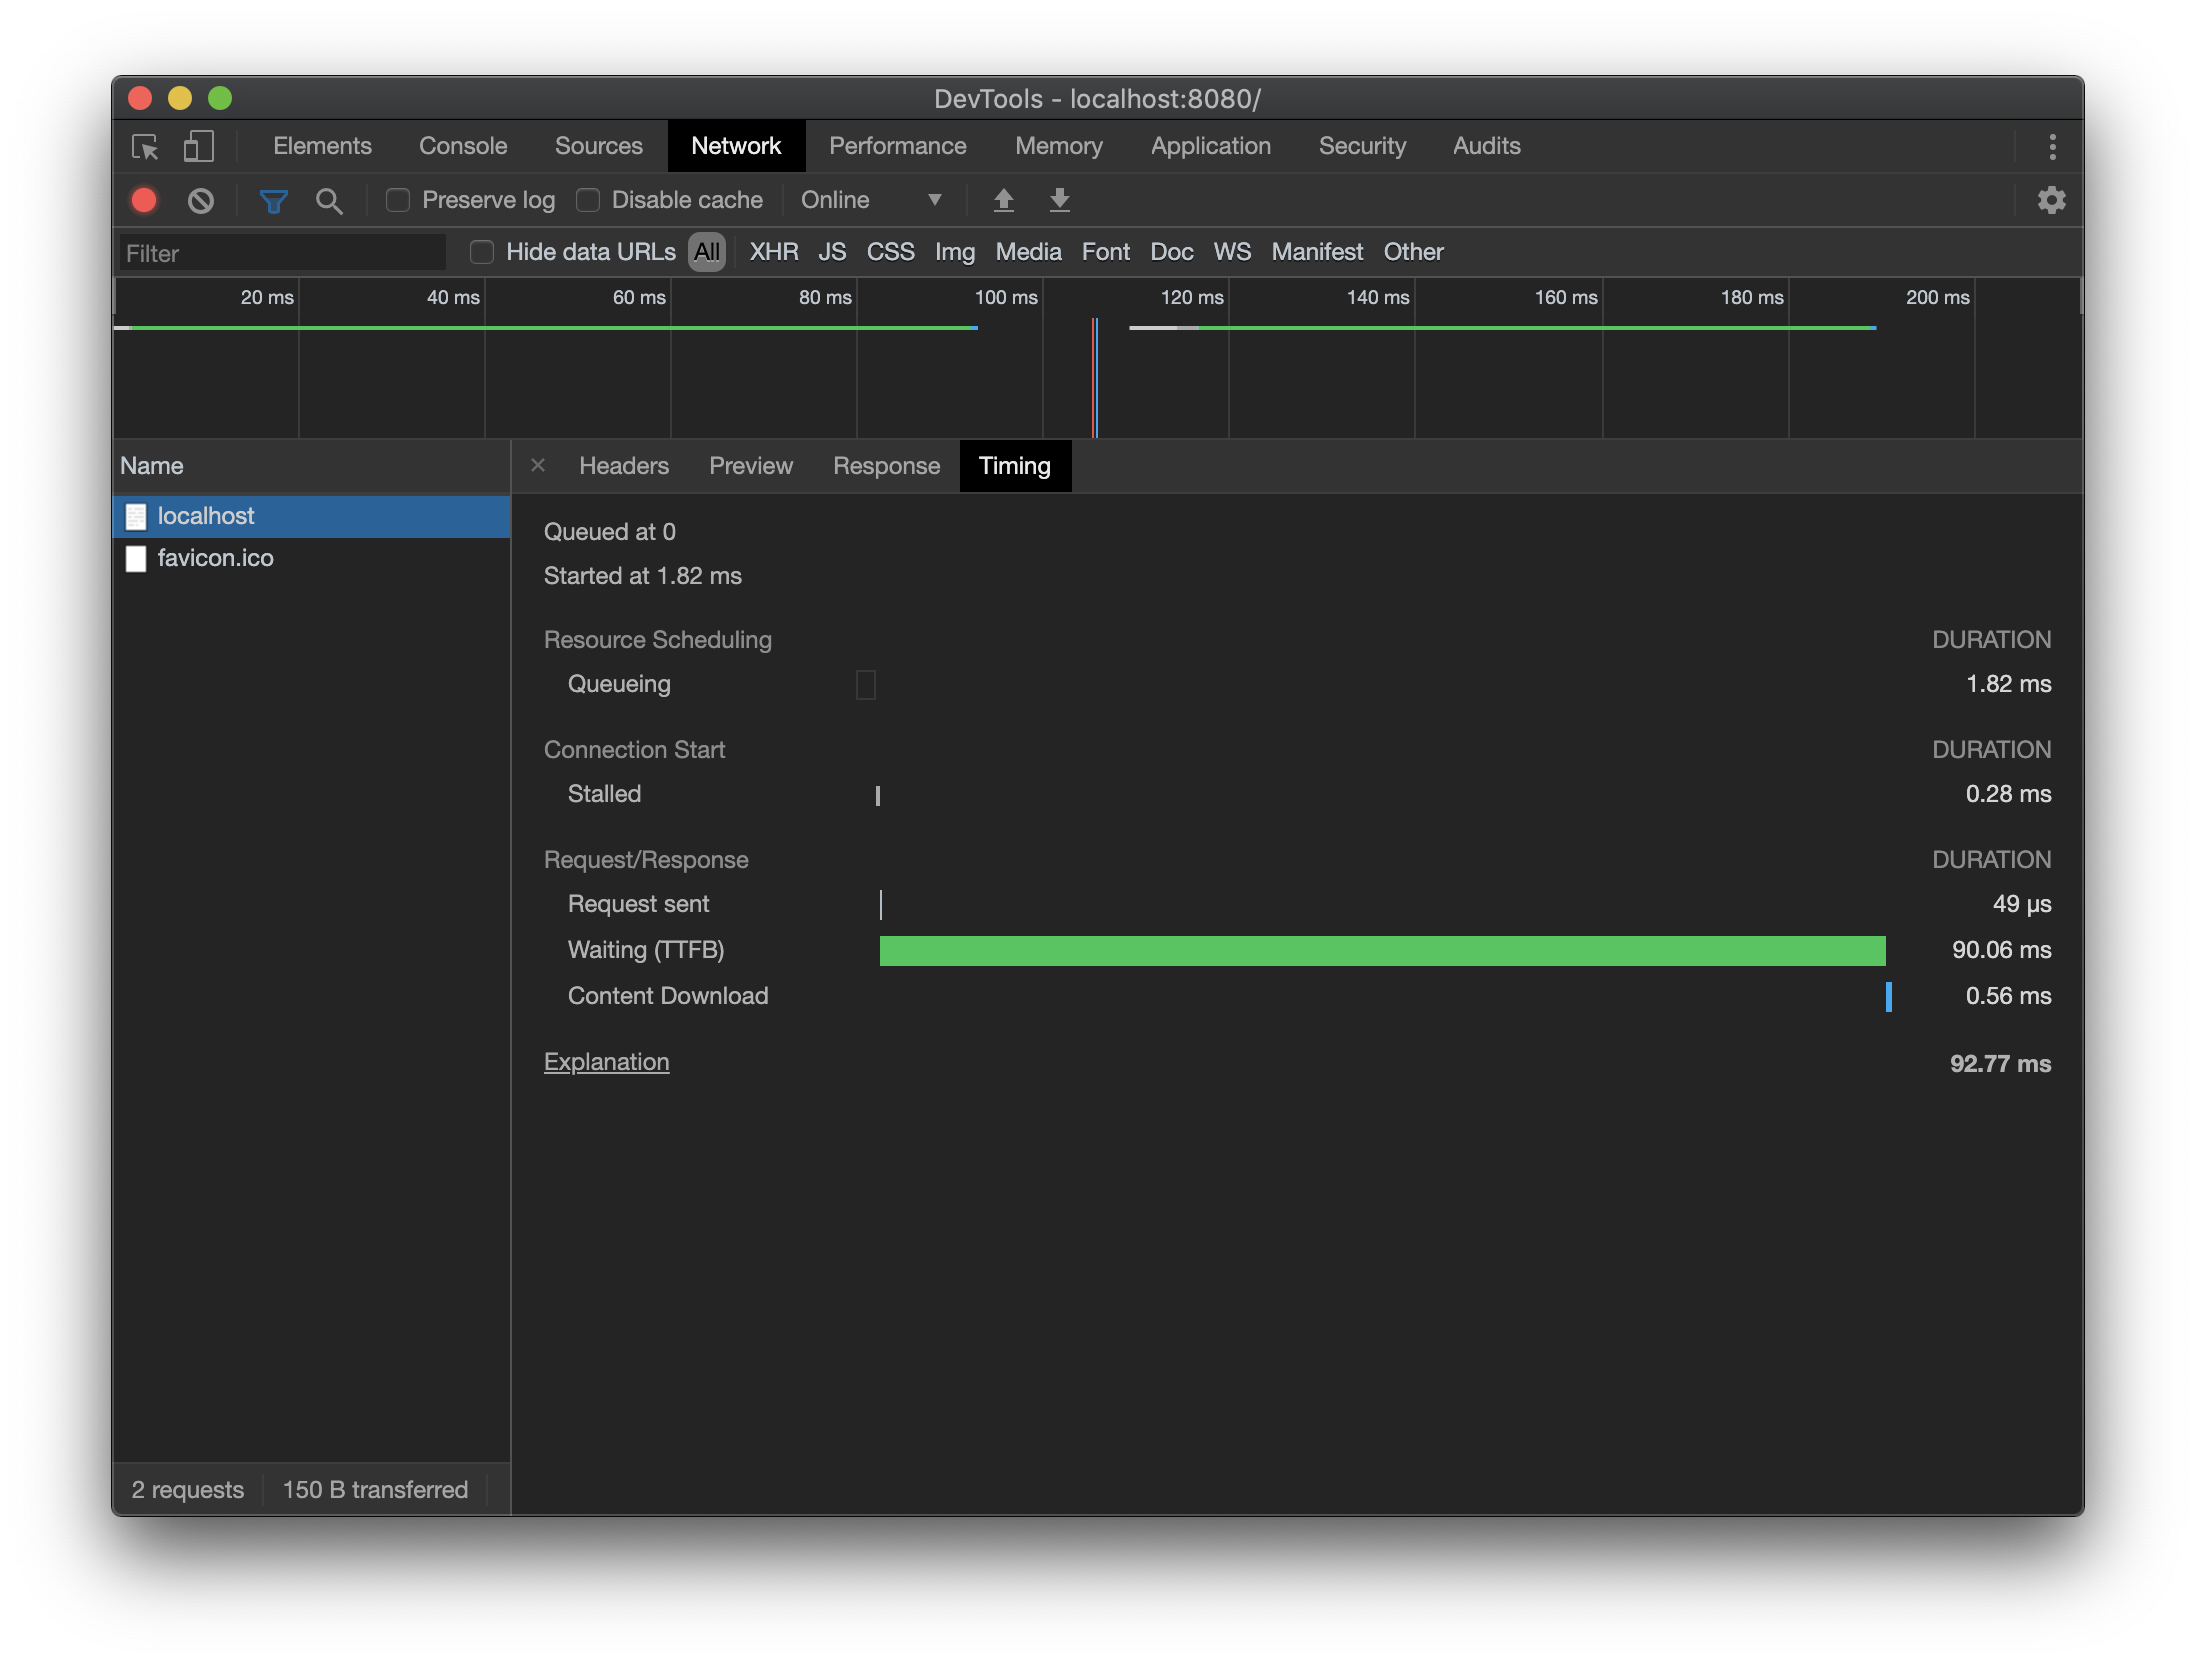
The Network tab tells us a lot about the behaviour of requests as observed by the browser. For this simple request, we can see that the majority of the time was spent waiting on a response from the server. This is known as the time to first byte or TTFB. Whilst this is useful information, it doesn’t tell us anything about what was going on on the back-end during this time. For that, we need to leave the comfort and power of the browser DevTools and head server side; or at least we used to.
I recently discovered the working draft (v7, latest) of the Server Timing specification from the W3C. This specification (implemented in most modern browsers) allows developers to augment the DevTools timing graphs with server timing information.
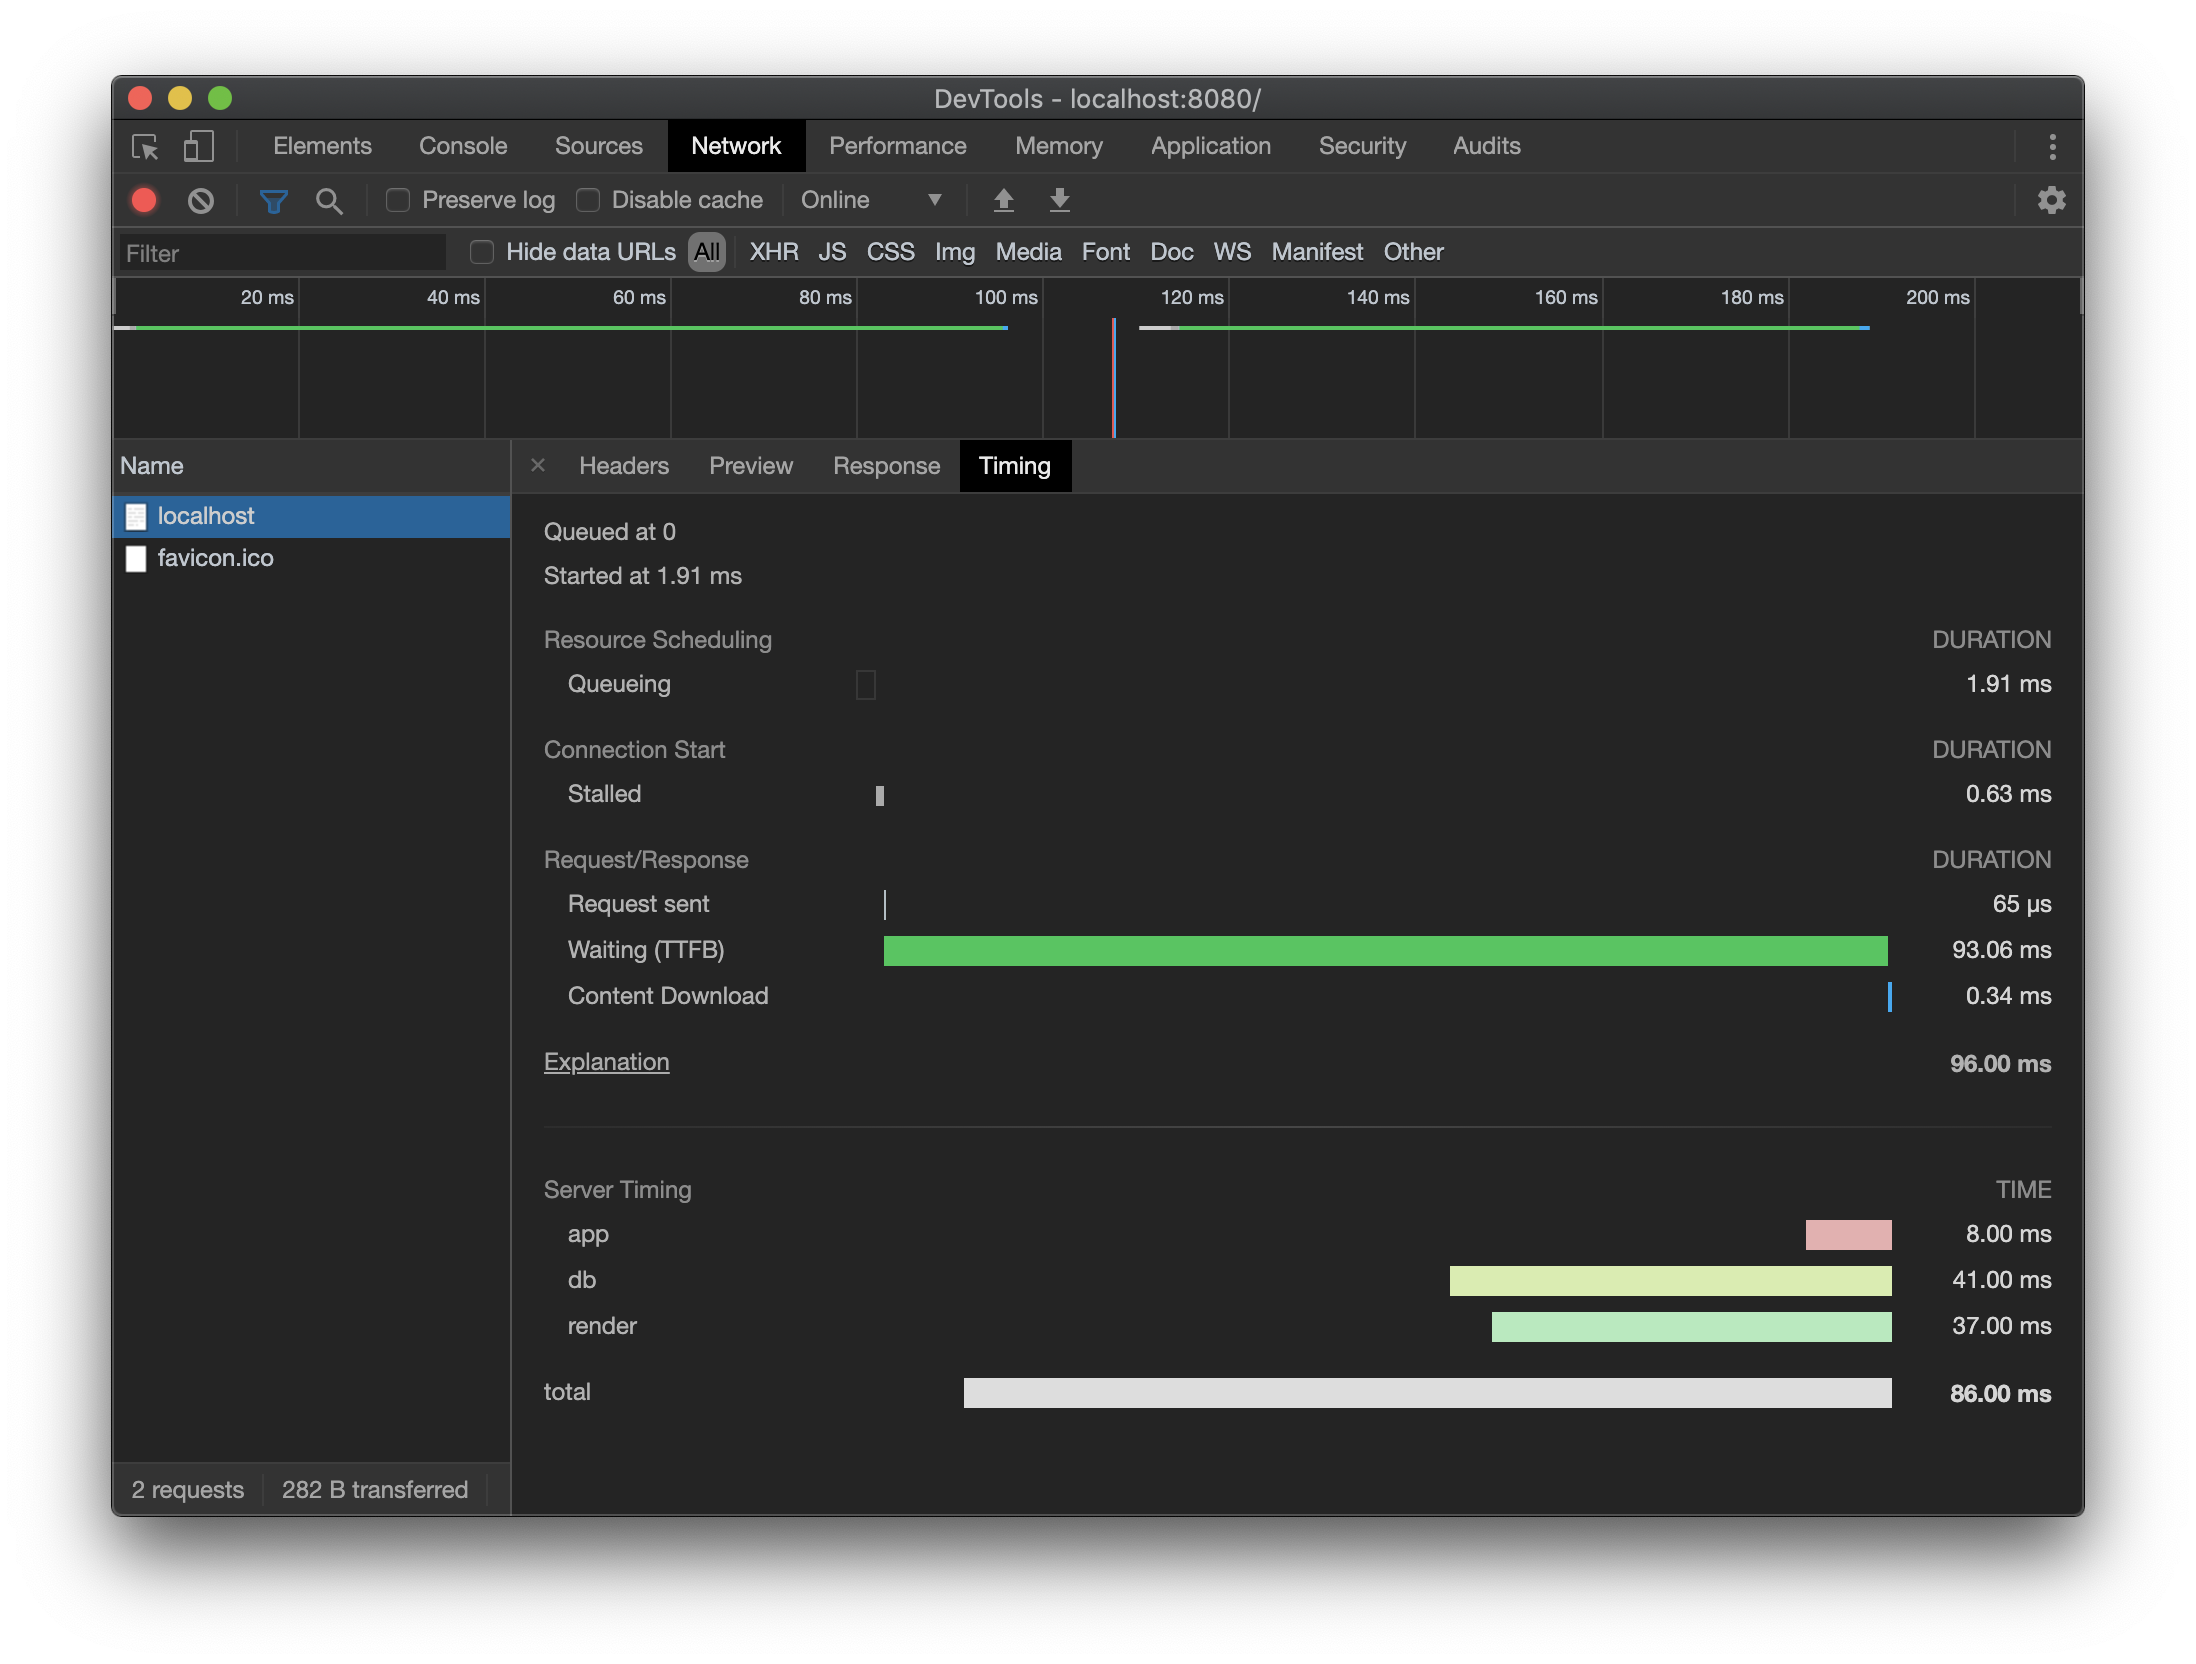
In the screenshot above we can see the new server timing information showing the time taken by various back-end tasks.
- App: 8ms
- DB: 41ms
- Render: 37ms
- Total: 86ms
I have instructed the browser to augment the network timing information with server-side timing by including the Server-Timing header in the response. The Mozilla Developer Network documentation gives a succinct description of the syntax: Server Timing.
The example shown above required the addition of a single header to our server response. The header contained the name and timing information for four components. It is possible to add a component description if desired.
Server-Timing: total;dur=86, db;dur=41, app;dur=8, render;dur=37
This solution is elegant in its simplicity. If you have access to DevTools in the browser, this information is used to augment the Network timing charts. Without them, the information is human readable and just as useful.
For all its simplicity, there are some significant limitations with the Server-Timing header. You can’t, for example, show the sequencing of the server-side timing components in the way that client-side timing is displayed. Far more challenging though, is change in the typical back-end. As it becomes common to depend on an increasing number services and storage systems to respond to web requests, back-end performance characteristics have become increasingly complex. Gone are the days when a back-end application server made a request to the database and rendered the response. Even a moderately complex back-end will require deeper insight to understand the performance of the system. However, used sensibly, it might be possible to afford front-end developers a little more insight into that time to first byte.
The application used to generate the timing graphs above is listed below.
package main

import (
	"fmt"
	"math/rand"
	"net/http"
	"os"
	"time"
)

func main() {
	s := http.Server{
		ReadTimeout:  500 * time.Millisecond,
		WriteTimeout: 500 * time.Millisecond,
		Addr:         ":8080",
	}

	http.HandleFunc("/", handler)

	err := s.ListenAndServe()
	if err != nil {
		fmt.Fprintln(os.Stderr, err)
		os.Exit(1)
	}
}

func handler(w http.ResponseWriter, r *http.Request) {
	dbms := rand.Intn(50)
	time.Sleep(time.Millisecond * time.Duration(dbms))

	appms := rand.Intn(50)
	time.Sleep(time.Millisecond * time.Duration(appms))

	renderms := rand.Intn(50)
	time.Sleep(time.Millisecond * time.Duration(renderms))

	totalms := dbms + appms + renderms

	w.Header().Set("Server-Timing",
		fmt.Sprintf("total;dur=%d, db;dur=%d, app;dur=%d, render;dur=%d",
			totalms,
			dbms,
			appms,
			renderms))
}