Introduction
Organisations of all sizes are now deploying applications to platforms such as Kubernetes. Many of these applications do not adopt cloud native practices. Often the excuse is application age or product limitation.
Many teams invest in platform infrastructure but failed to capitalise on these benefits. So what gives? Are platforms overhyped? Are the complexities of the enterprise too much for modern platforms?
Engineers deploy applications to Kubernetes to take advantage of common platform features. Many of these features claim to help maintain service availability including:
- Horizontal Scaling
- Automated Rollouts and Rollbacks
- Self-healing
To capitalise on these platform capabilities, applications need to be platform aware. They need to be cloud native. An oft overlooked example is health probes. Without these endpoints, platforms can only make crude assessments of application health and consumers can expect to experience service interruption during common platform operations. Worse still, this interruption may be invisible to service owners.
In this post, we deploy a Product Catalogue service on Kubernetes. This mock service returns a list of products to an online store. We show that, without health probes, common platform operations result in service disruption. We show how the addition of these probes reduces these service interruptions.
Standard Behaviour
The application we are going to use is a catalogue service for an e-commerce store. We aren’t going to build a full featured product catalogue for this. Instead we’ll be opting for a service that responds with a hard-coded product list.
{
    "payload": [
        {
            "id": "8cb4cbad-55ac-43b4-a847-5643ef1e91f7",
            "name": "Kubernetes",
            "price": {
                "currency": "GBP",
                "display": "£12.34",
                "value": 1234
            },
            "quantity": 2,
            "unit": "kg"
        },
        {
            "id": "078d7297-9f60-4300-9c16-2b7e00c3924a",
            "name": "Kubernetes",
            "price": {
                "currency": "GBP",
                "display": "23.45",
                "value": 2345
            },
            "quantity": 4,
            "unit": "kg"
        }
    ]
}
A service like this lacks many of the characteristics of typical applications. It’s inherent simplicity means it is fast to start and has a predictable response time. There are no external dependencies that could fail. To simulate real-world behaviour, we’ve added a couple of features including:
- Start-Up delay - Most applications take time to load resources on startup. I’ve seen this take anywhere from a couple of seconds to a couple of minutes. Here we are using a start-up time of 30s, but this is configurable if you’d like to experiment.
- Random response time - Response times aren’t instantaneous. A real catalogue service would need to request a list of products from a database. We simulate that with a normally distributed delay centred on a 5ms response time.
- A
/crashendpoint - We expose an endpoint that allows us to trigger a crash and terminate the process. - A
/hangendpoint - We expose an endpoint that allows us to trigger a hung application. This doesn’t cause the process to terminate, but does prevent it from serving any new requests.
We deploy this as a Pod on Kubernetes along with a Service that exposes our endpoint outside the cluster.
apiVersion: apps/v1
kind: Deployment
metadata:
  name: catalogue
spec:
  replicas: 1
  selector:
    matchLabels:
      app: catalogue
  template:
    metadata:
      labels:
        app: catalogue
    spec:
      containers:
      - name: catalogue
        image: billglover/tanzu-store-catalogue:0.0.1
        ports:
        - containerPort: 8080
        env:
        - name: PORT
          value: "8080"
        - name: DELAY
          value: "30s"
apiVersion: v1
kind: Service
metadata:
  name: catalogue
spec:
  type: LoadBalancer
  selector:
    app: catalogue
  ports:
  - name: http
    port: 8080
    targetPort: 8080
We test everything is working by making a request to our endpoint.
curl -X GET http://localhost:8080/catalogue
{"payload":[{"id":"8cb4cbad-55ac-43b4-a847-5643ef1e91f7","name":"Kubernetes","unit":"kg","quantity":2,"price":{"currency":"GBP","value":1234,"display":"£12.34"}},{"id":"078d7297-9f60-4300-9c16-2b7e00c3924a","name":"Kubernetes","unit":"kg","quantity":4,"price":{"currency":"GBP","value":2345,"display":"23.45"}}]}
To show how our application behaves during platform operations, we need a way to send it requests. I’m going to use Vegeta to send our service 5 requests per second. The resulting graph shows a rolling summary of status code and response time. This gives us an easy way to see service failures.
Any response that isn’t in the HTTP 2xx range will impact the end user. This is what I’m calling service interruption or an error response. Under normal operation, we expect to see no errors from our service.
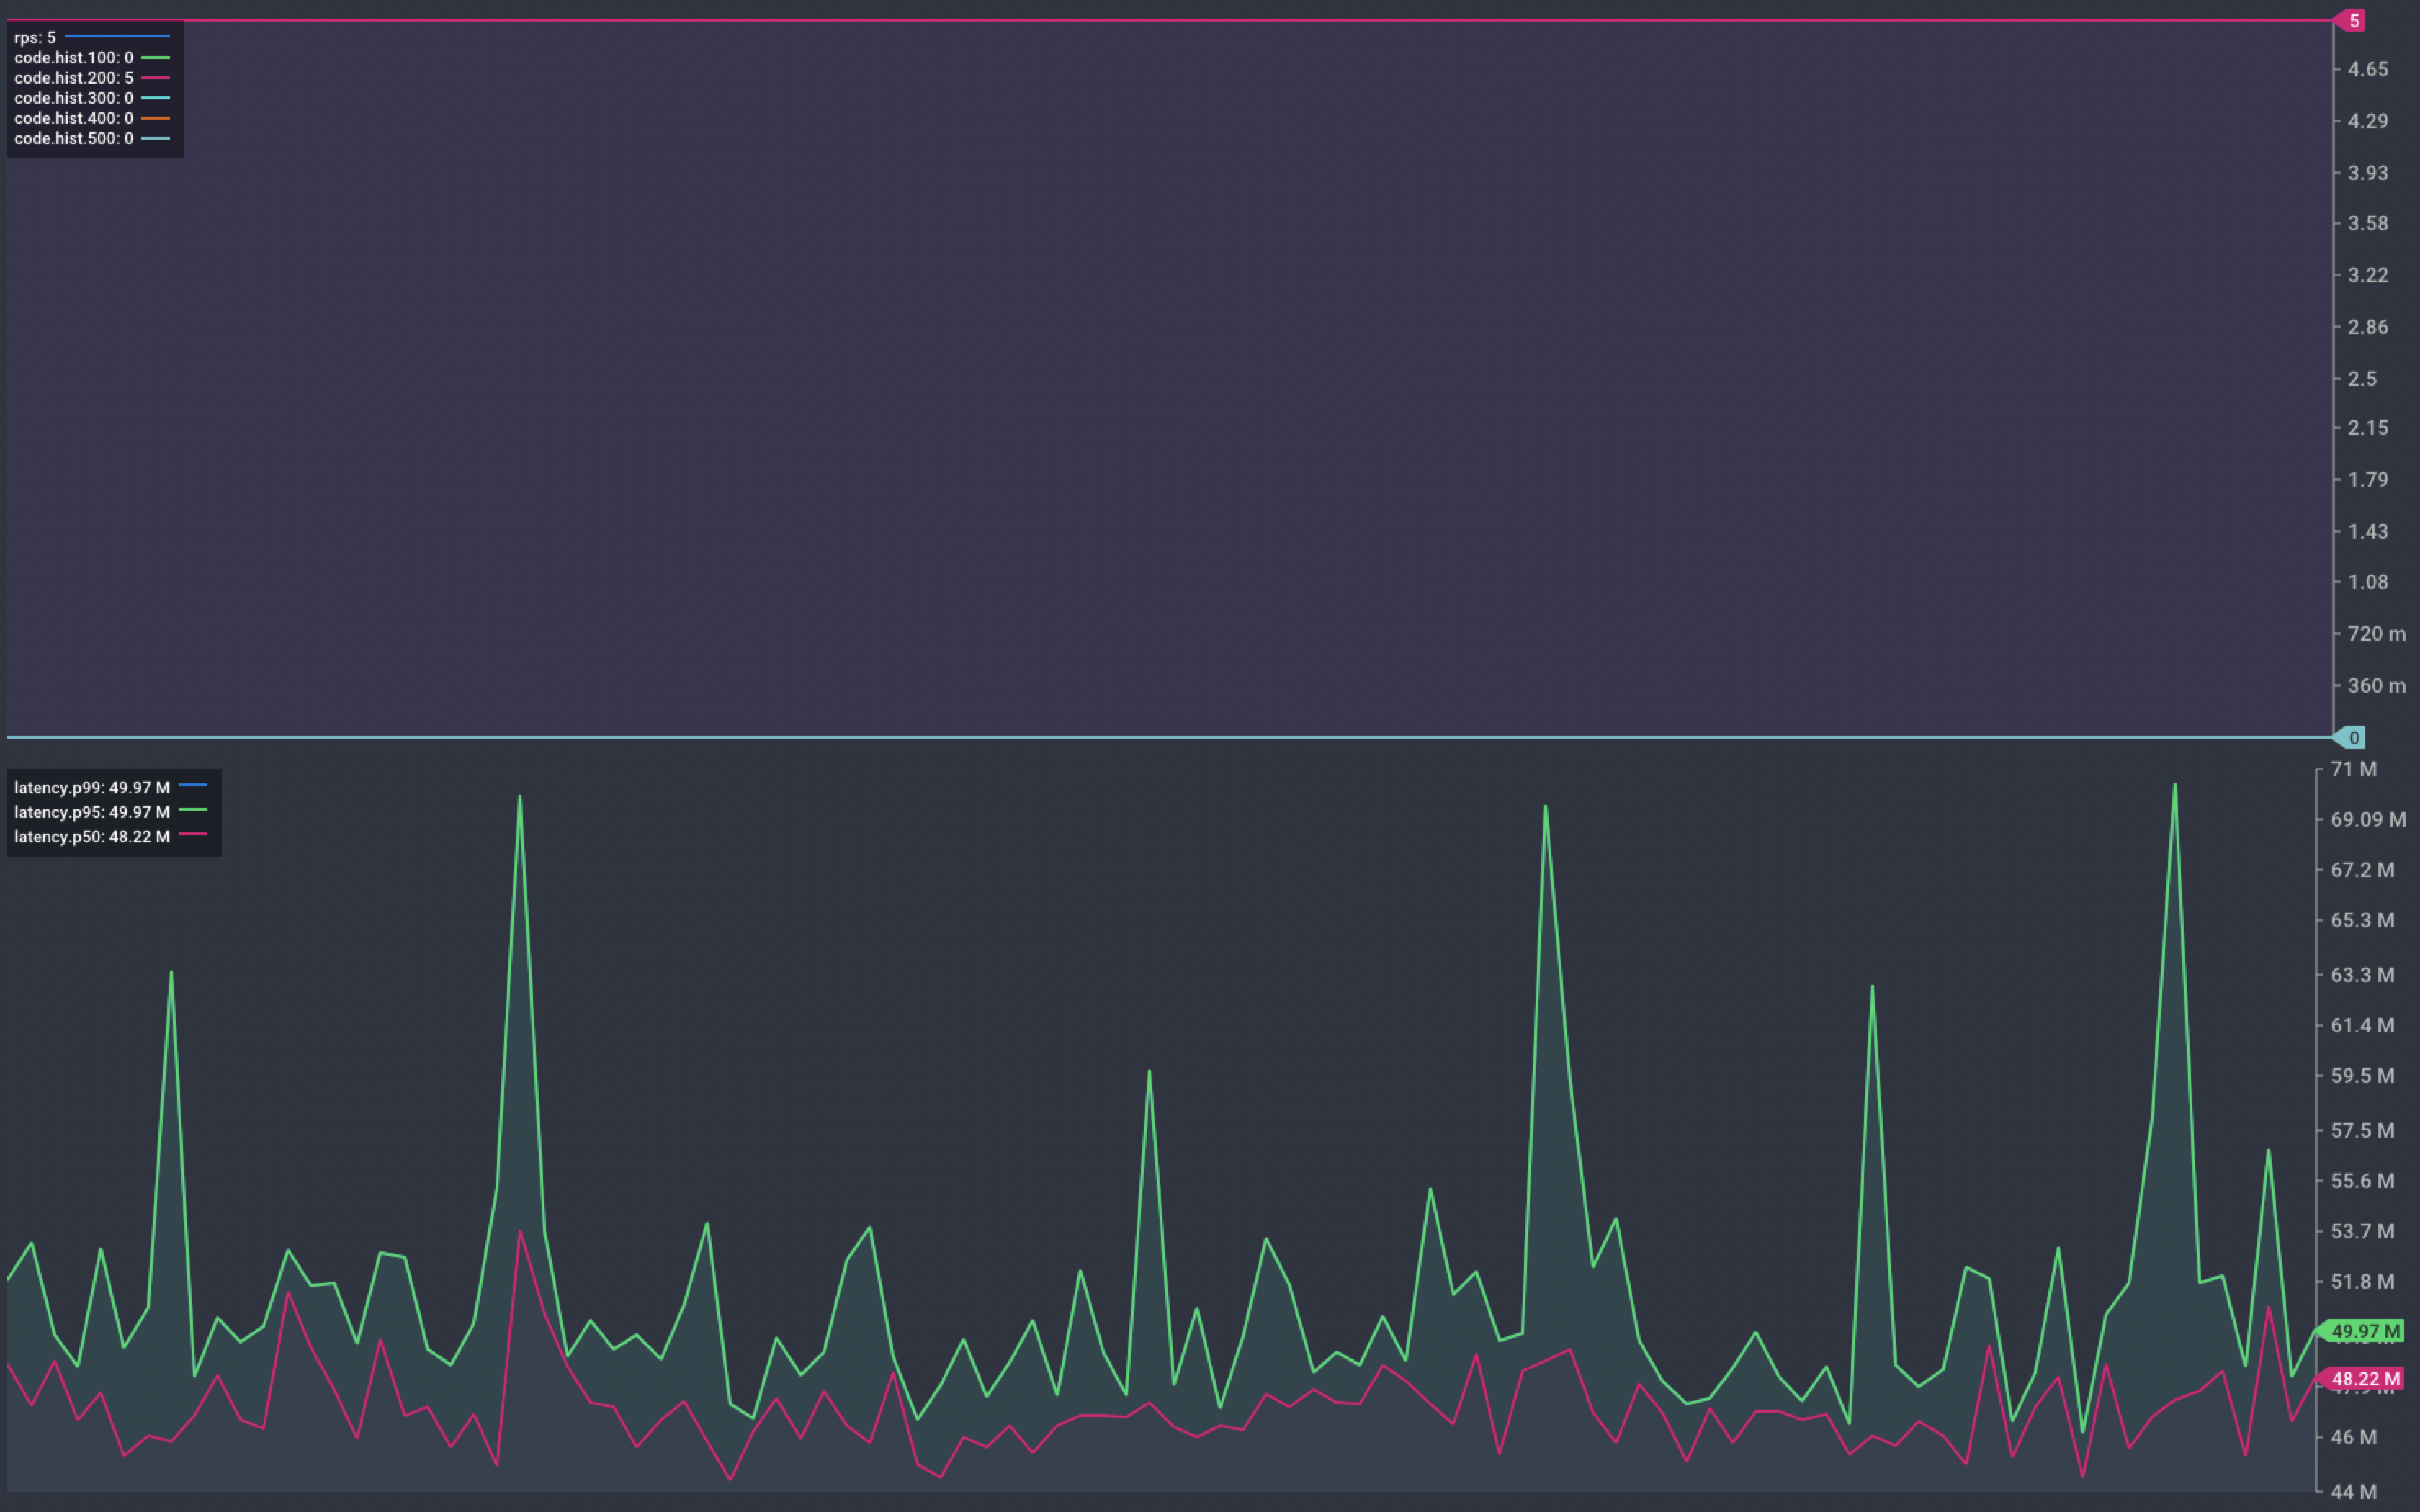
Chart showing response from our service during normal operation
Scaling Up
Adding capacity is not considered a disruptive operation. The catalogue service starts with a single instance. We scale this up to five instances and watch for any changes in service status.
k scale deployment catalogue --replicas 5
deployment.apps/catalogue scaled
The chart below shows that the scaling operation results in service interruption. Things settle back down to normal and we return to serving 5 req/s without issue.
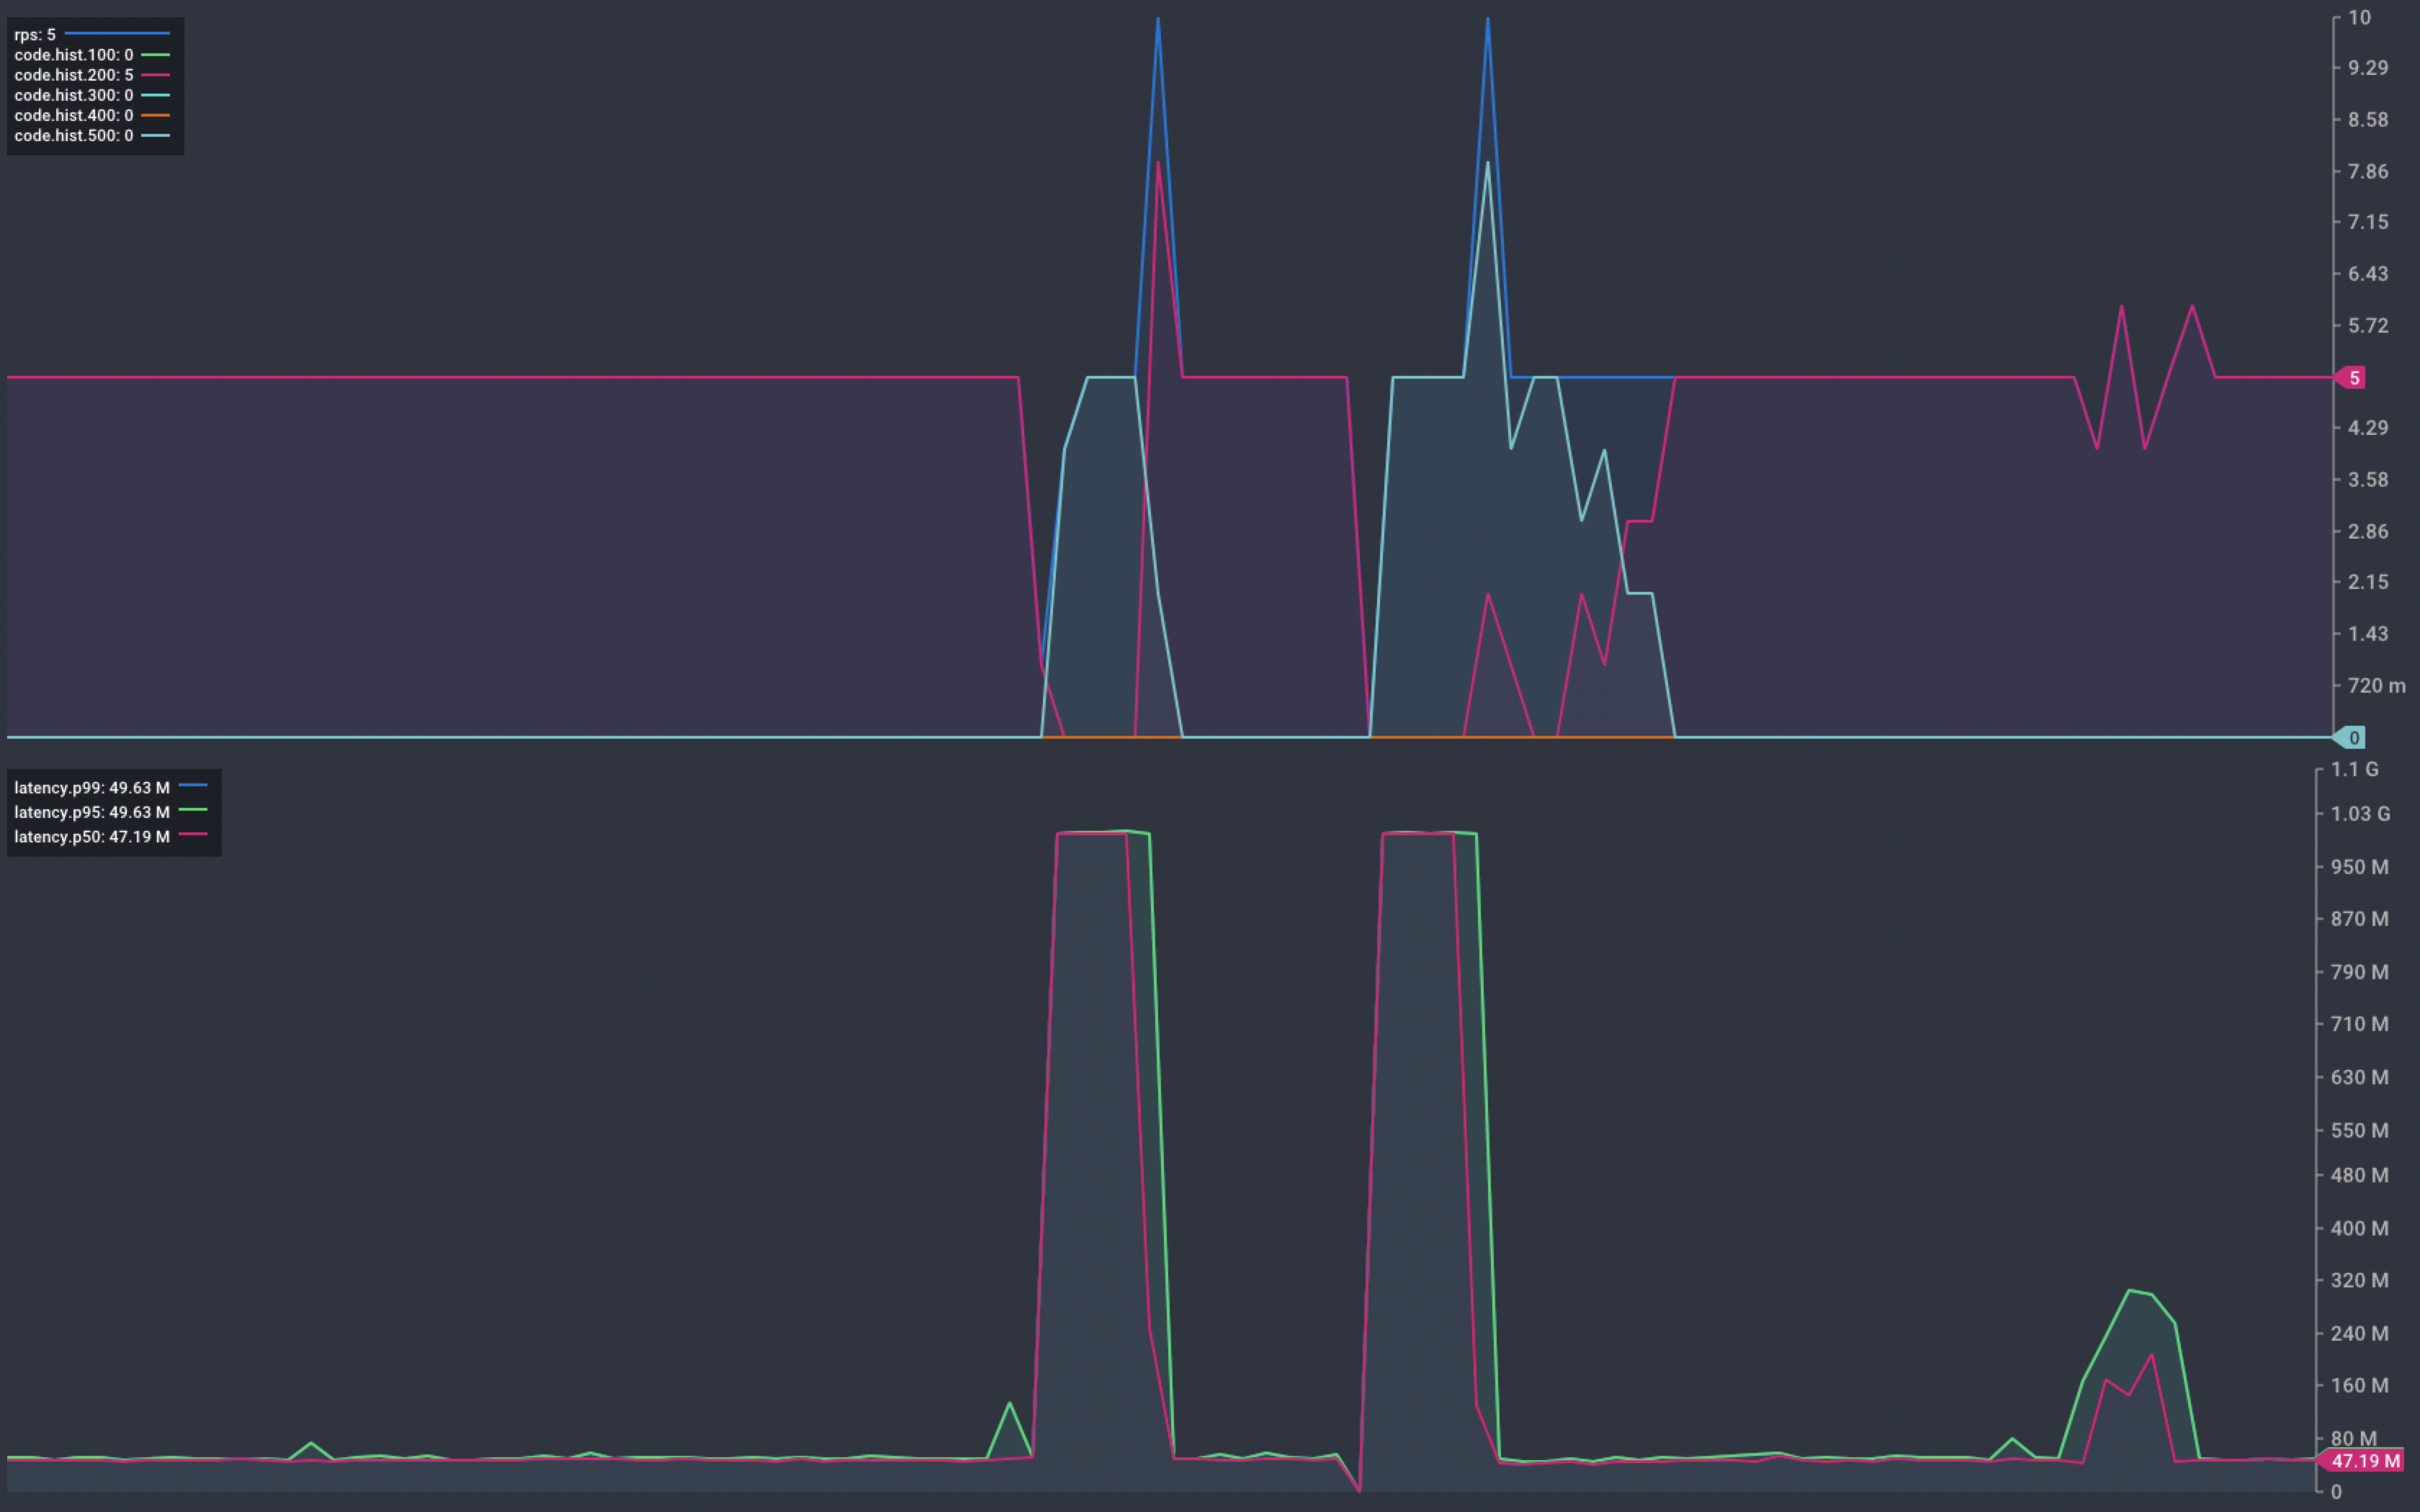
Chart showing response from our service during scaling
Deployment
Kubernetes offers the ability to deploy application updates without service interruption. If things don’t work out, a roll-back is as easy. By default, Kubernetes deploys new instances before terminating old ones. This ensures that there is always capacity available to handle inbound traffic.
“By default, it ensures that at least 75% of the desired number of Pods are up (25% max unavailable).
“By default, it ensures that at most 125% of the desired number of Pods are up (25% max surge).”
We start with 5 instances of our service. We can expect that at any point there will be between 4 and 6 pods are available to handle requests.
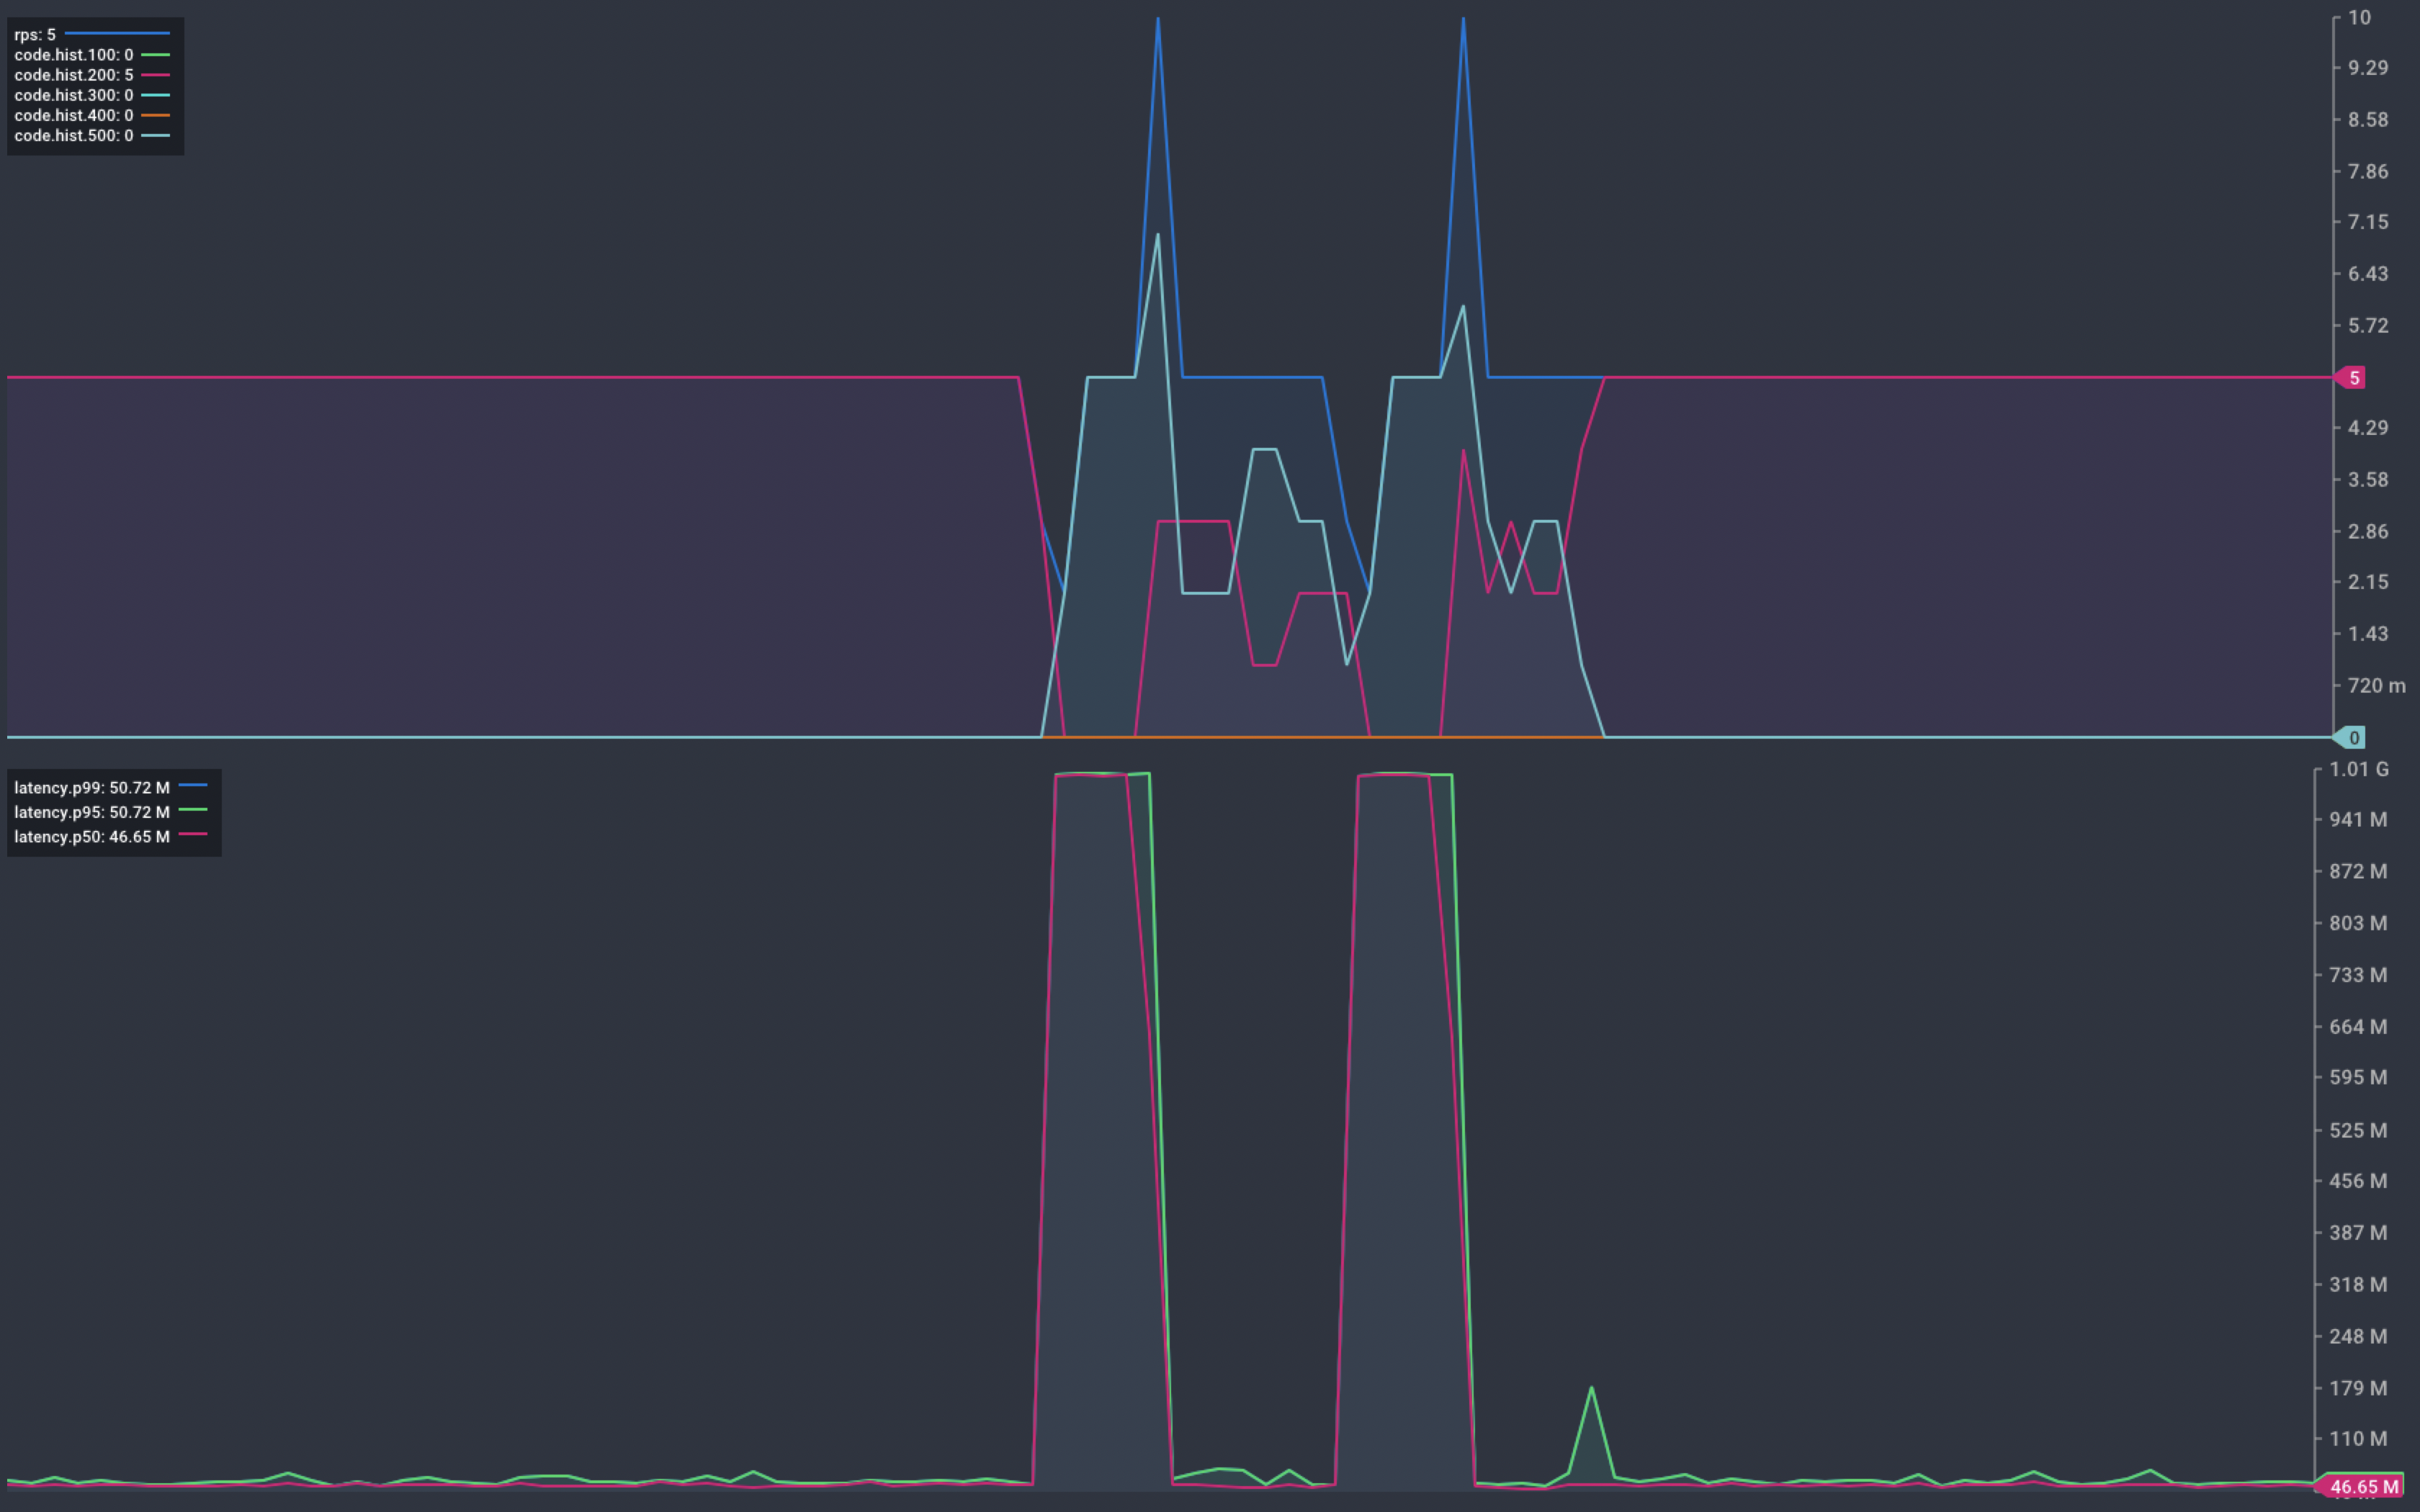
Chart showing response from our service during deployment
During deployment we see a very similar pattern of service interruption. This occurs as the new instances start up.
Pod Lifecycle
When running on Kubernetes, we don’t expect service interruption during these common operations. To understand why we are seeing this, we need to look at the Pod lifecycle.
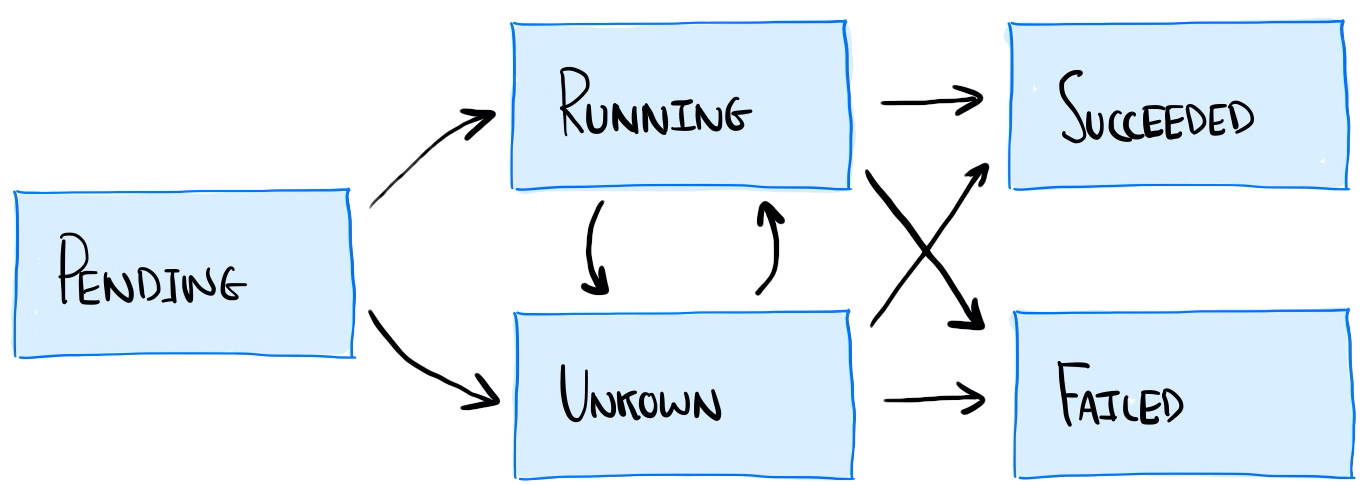
Diagram showing the pod lifecycle in Kubernetes
“Running: The Pod has been bound to a node, and all of the Containers have been created. At least one Container is still running, or is in the process of starting or restarting.” – Kubernetes Documentation, Pod Phase
Our container transitions from the Pending state, to Running. As soon as it enters the Running state it becomes Ready. When this happens, the service that sits in front of our pods immediately begins to route traffic to Pods.
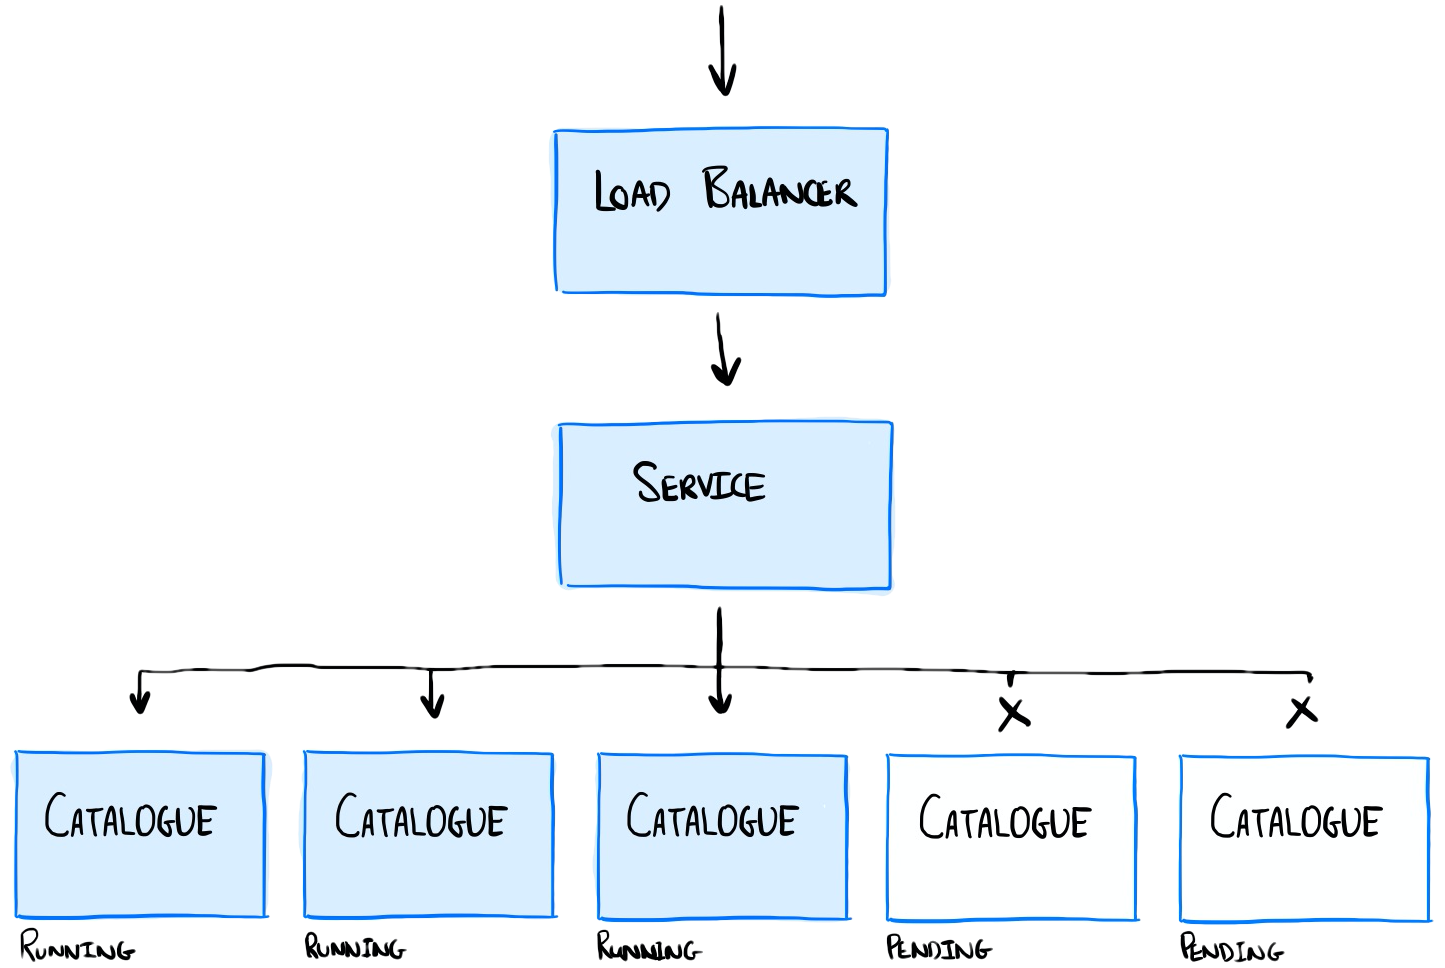
Diagram showing the deployment of the catalogue service. Running containers are shown in blue.
Remember that our application has a non-zero start-up time. It takes a further 10s after the process starts before it is ready to handle inbound requests. Any requests routed to our application during this time risk timing out.
This explains the behaviour we see during both scaling and deployment operations. Requests are being routed to our containers too early, we aren’t ready to handle them.
Factor 9 in the 12 Factors of Cloud Native applications states:
“Maximise robustness with fast startup and graceful shutdown”
This is a noble aim, but applications tend to have a non-zero startup time. This is particularly true of applications built before the era of Cloud computing.
We’ve seen how platform operations can result in service interruption. In the rest of this post, we’ll explore two ways to mitigate this unwanted behaviour. These centre on a core premise: Requests should not be routed to our application if it is not ready to receive them.
Readiness Probes
Kubernetes provides the ability to define readiness probes.
“A pod with containers reporting that they are not ready does not receive traffic through Kubernetes Services.”
Readiness probes have three mechanisms to determine Pod readiness:
- execute a command inside the pod
- connect to a TCP endpoint
- make an HTTP Get request
For new applications, it is common to use a HTTP Get request to surface application health. We add a Readiness probe by modifying our deployment definition file below.
---
apiVersion: apps/v1
kind: Deployment
metadata:
  name: catalogue
spec:
  replicas: 1
  selector:
    matchLabels:
      app: catalogue
  template:
    metadata:
      labels:
        app: catalogue
    spec:
      containers:
      - name: catalogue
        image: billglover/tanzu-store-catalogue:0.0.1
        imagePullPolicy: Always
        readinessProbe:
          httpGet:
            path: /healthz
            port: 8080
          initialDelaySeconds: 30
          periodSeconds: 1
        ports:
        - containerPort: 8080
        env:
        - name: PORT
          value: "8080"
        - name: DELAY
          value: "10s"
        resources:
          limits:
            memory: "32Mi"
            cpu: "250m"
We re-deploy our service and repeat the same scale up and deployment operations as before.
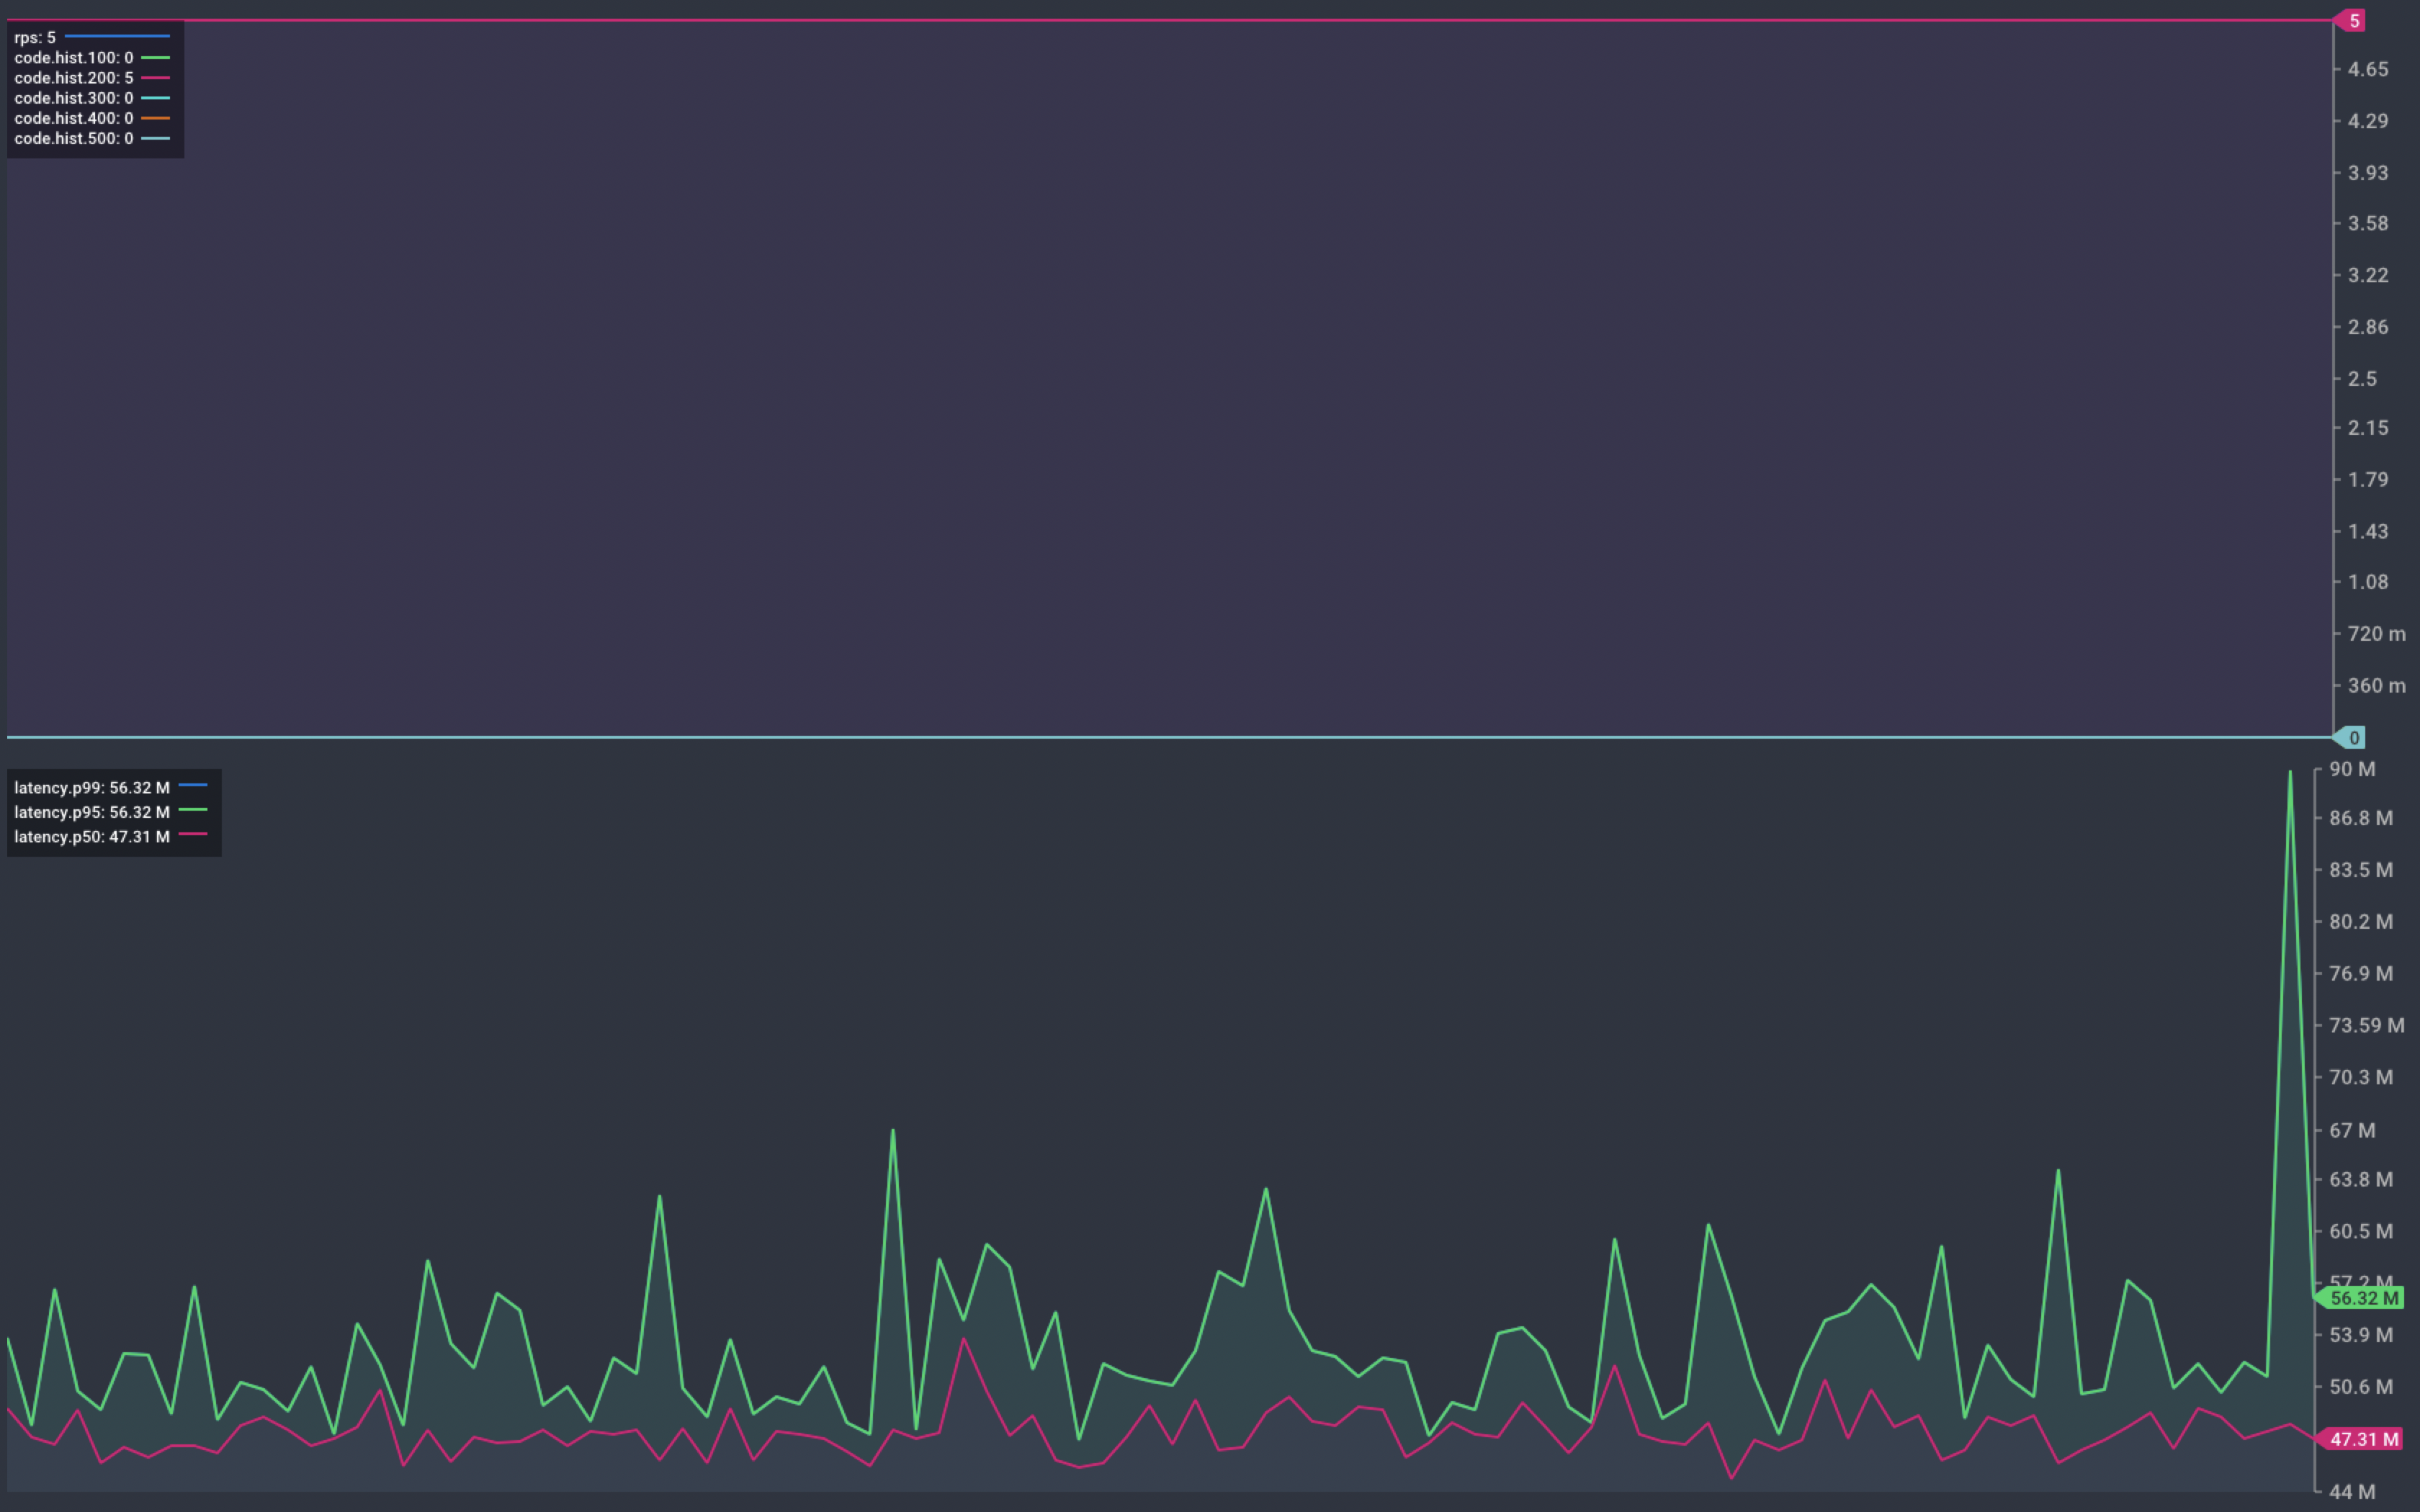
Chart showing response from our service during scaling and deployment
This time, the graph shows no failed requests. The instances complete their startup delay before being marked Ready to receive requests.
Problem solved. Or is it?
Liveness Probes
Readiness probes to ensure containers don’t receive requests during startup. But what happens in other stages of the Pod lifecycle? What happens if the container crashes, or if it hangs and becomes unresponsive? We expect the platform to handle both these scenarios for us.
To test this we are going to trigger both failure modes using two purpose built endpoints.
/crash- Causes our application to crash immediately with a non-zero return code./hang- locks the application so that it hangs before responding to inbound requests.
We start by looking at what happens when our application crashes. When we trigger a crash, the container is re-started as we would expect.
k get pods
NAME                        READY   STATUS    RESTARTS   AGE
catalogue-ccd859978-7svjt   1/1     Running   0          5m25s
catalogue-ccd859978-9klbx   1/1     Running   0          4m15s
catalogue-ccd859978-gm557   1/1     Running   0          4m15s
catalogue-ccd859978-mfmc8   1/1     Running   0          4m15s
catalogue-ccd859978-q2drb   1/1     Running   1          4m15s
The graph below shows that we saw a single failed request during the crash. We saw no further errors during the re-start.
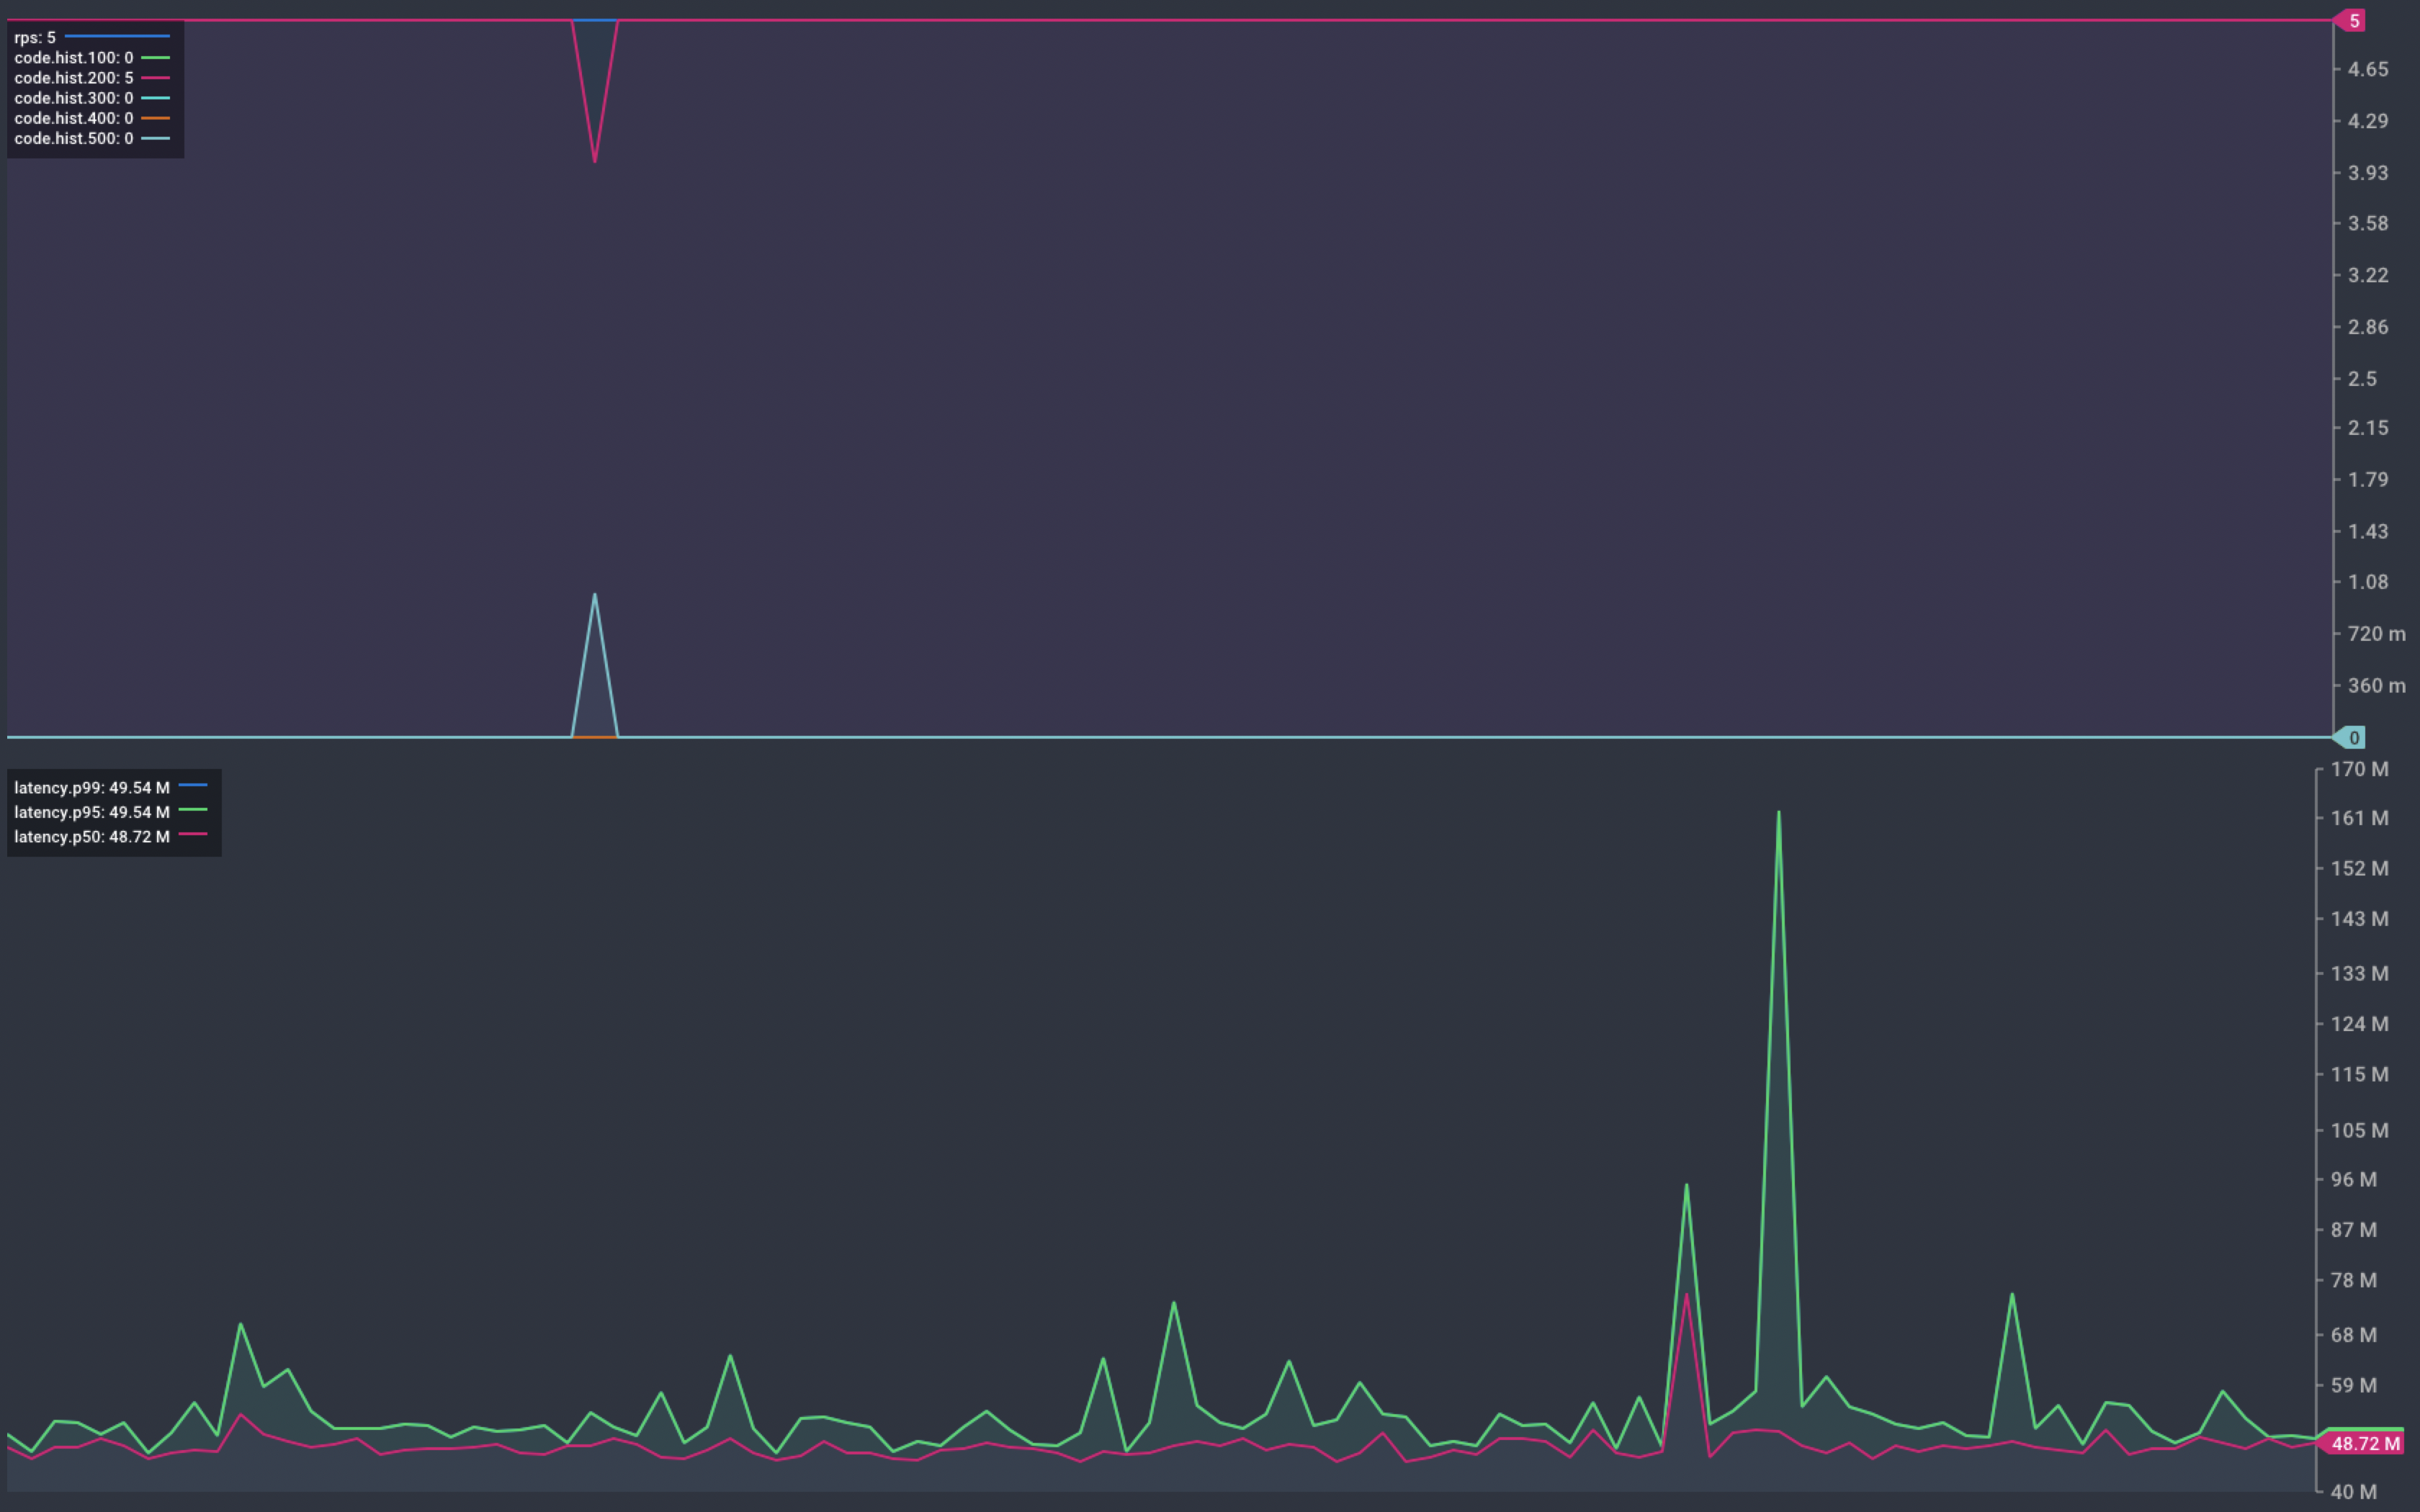
Chart showing response from our service during a container crash
The cause of this failed request could be one of the following:
- an in-flight request being handled by the container when it crashed
- a request sent to the container after it had crashed, but before the platform triggered a restart.
Remember, the polling interval for our readiness probe is set to 1 second. This is the detection window. We can’t reduce this with Kubernetes. If we could, doing so would increase the burden on platform resources. Requests arriving during the detection window may result in an error.
In the event of a container crash, the platform recovers and resumes normal operation. Next we’ll look at what happens when our application hangs.
To show this, we start with 5 instances of our catalogue service running.
k get pods
NAME                        READY   STATUS    RESTARTS   AGE
catalogue-ccd859978-8qlrr   1/1     Running   0          52s
catalogue-ccd859978-bjnk7   1/1     Running   0          52s
catalogue-ccd859978-h4kl7   1/1     Running   0          52s
catalogue-ccd859978-hcxbv   1/1     Running   0          52s
catalogue-ccd859978-hqbvh   1/1     Running   0          52s
We trigger one of these containers to hang by making a request to the /hang endpoint. We see a brief service interruption as we wait for the platform to detect that the container is no longer ready.
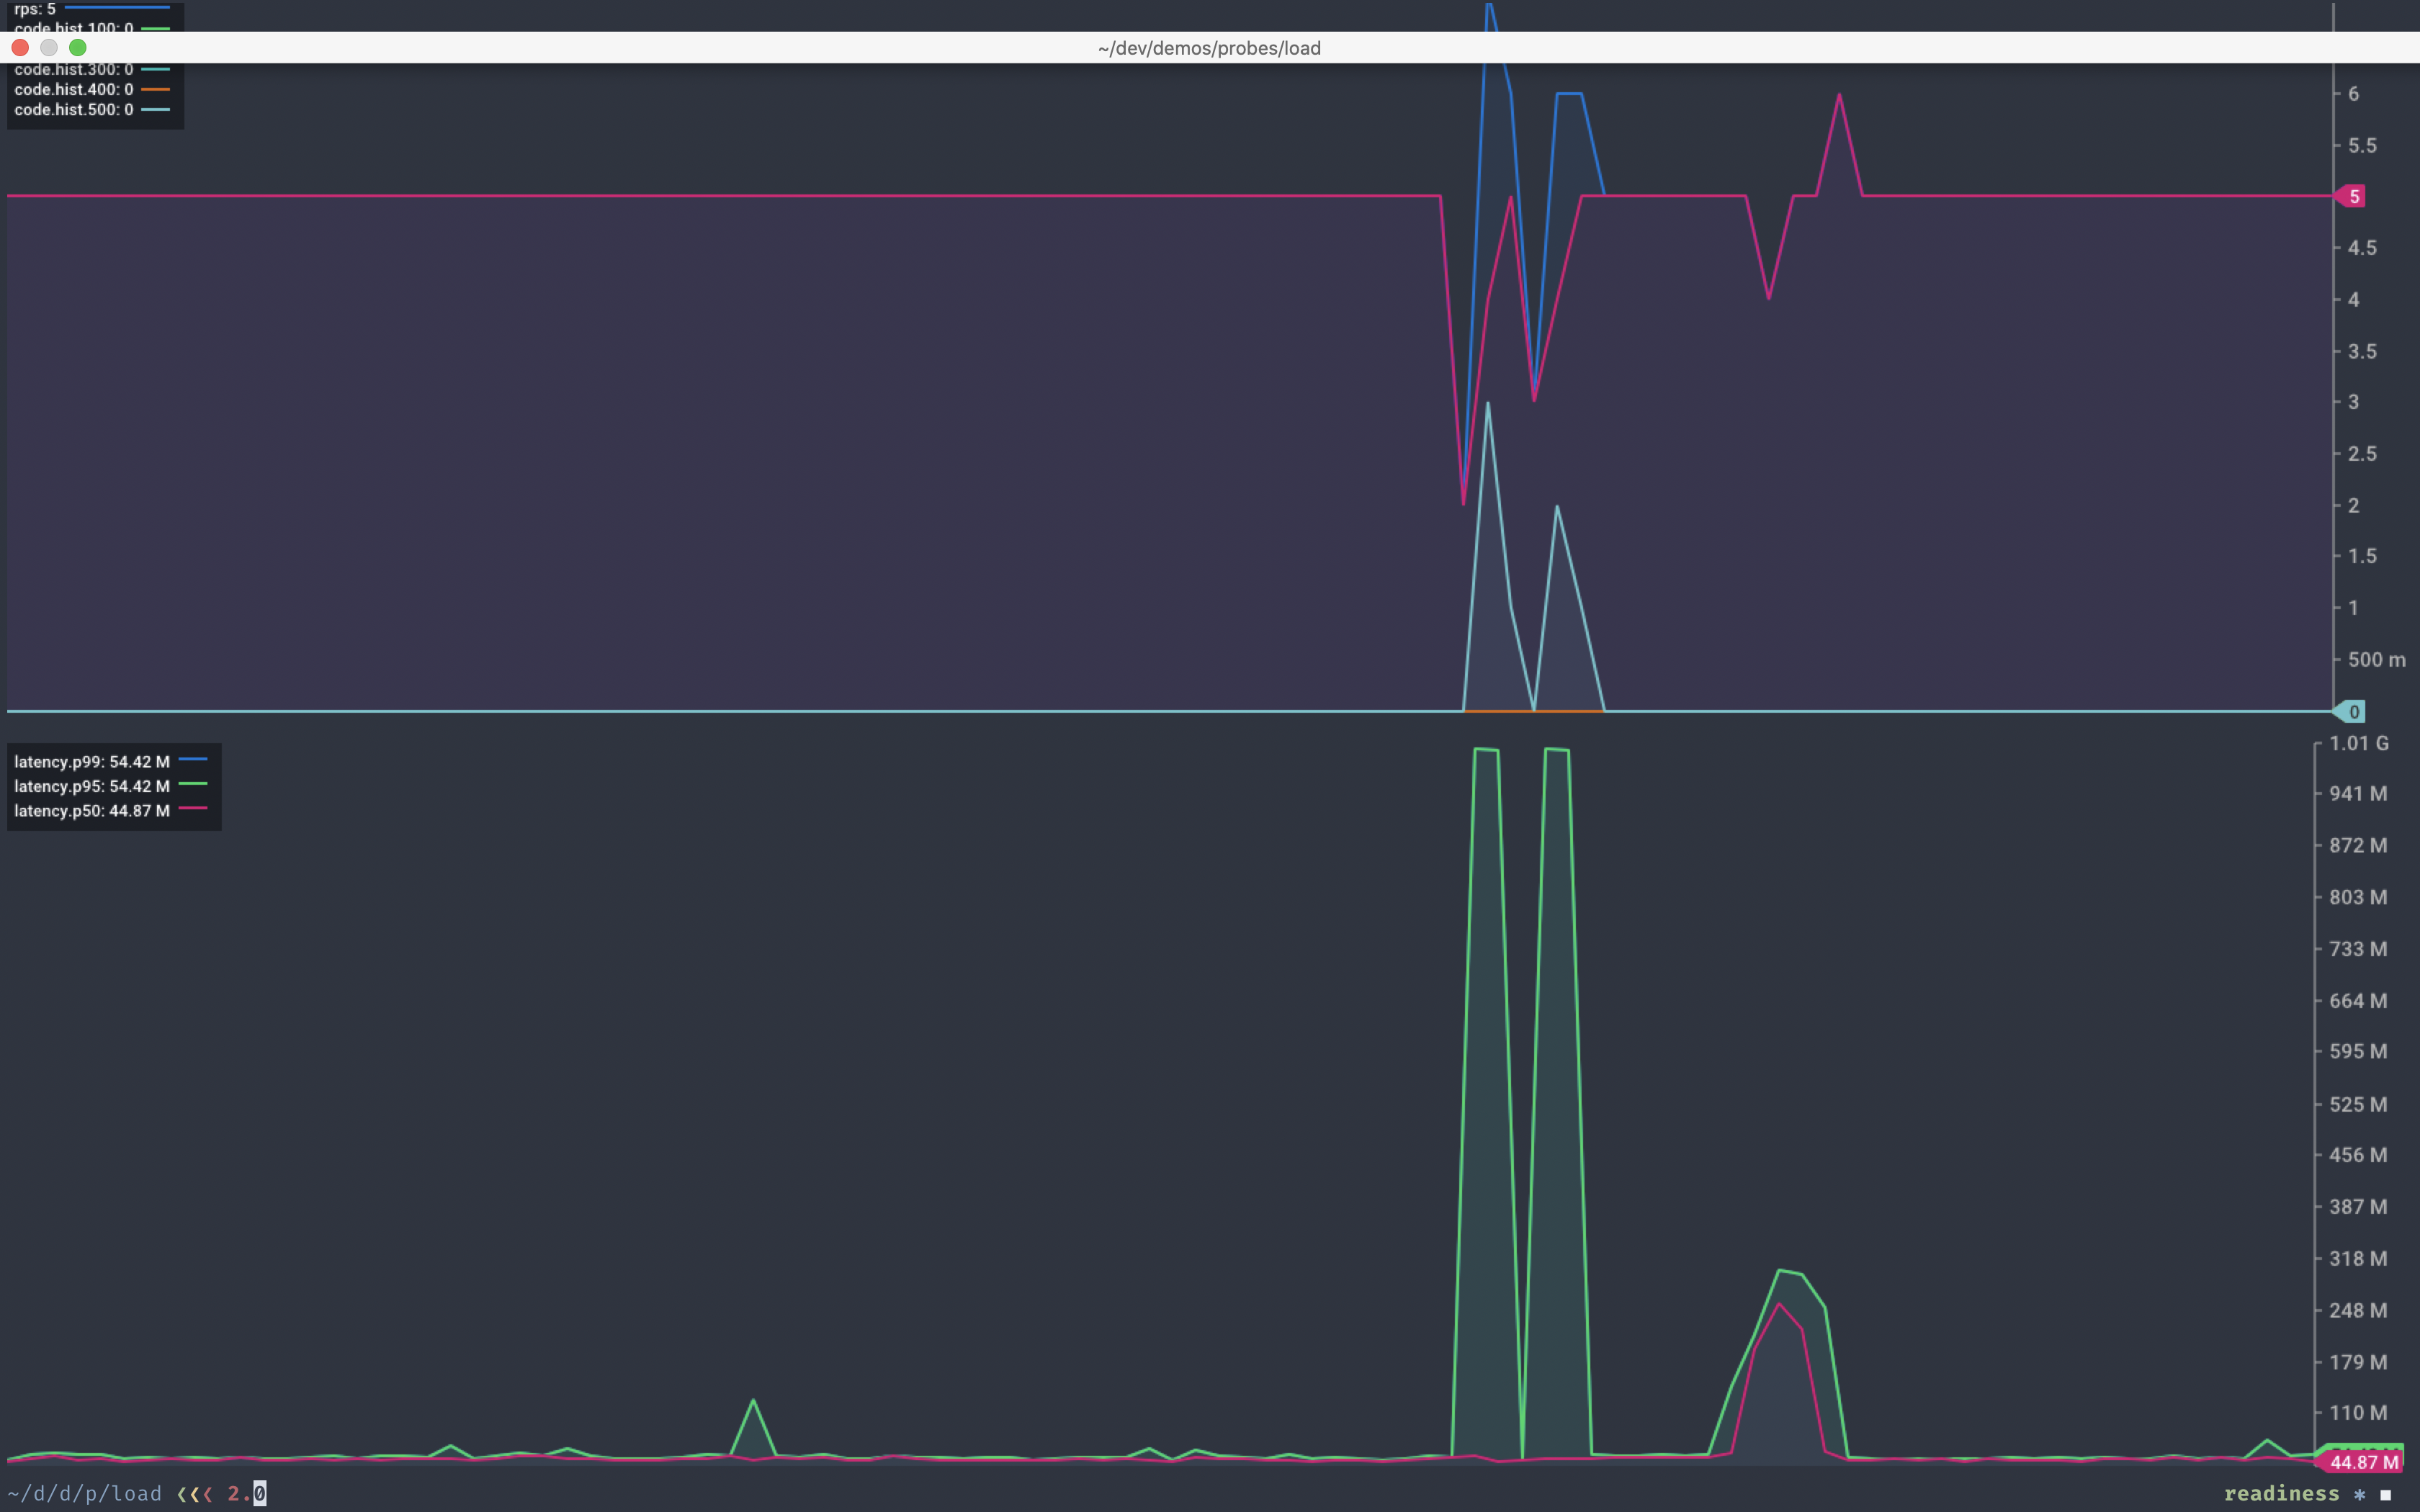
Chart showing response from our service during a hung container
The next execution of the readiness probe reports the container as not ready. The platform then removes it from service.
k get pods
NAME                        READY   STATUS    RESTARTS   AGE
catalogue-ccd859978-8qlrr   1/1     Running   0          4m16s
catalogue-ccd859978-bjnk7   1/1     Running   0          4m16s
catalogue-ccd859978-h4kl7   1/1     Running   0          4m16s
catalogue-ccd859978-hcxbv   0/1     Running   0          4m16s
catalogue-ccd859978-hqbvh   1/1     Running   0          4m16s
Other than the odd in-flight transaction failure, things still look normal. So far so good. But what happens as further containers hang?
k get pods
NAME                        READY   STATUS    RESTARTS   AGE
catalogue-ccd859978-8qlrr   0/1     Running   0          4m16s
catalogue-ccd859978-bjnk7   1/1     Running   0          4m16s
catalogue-ccd859978-h4kl7   1/1     Running   0          4m16s
catalogue-ccd859978-hcxbv   0/1     Running   0          4m16s
catalogue-ccd859978-hqbvh   1/1     Running   0          4m16s
As further containers hang the platform removes them from service. We reach the point where there are no longer any containers available to handle requests.
k get pods
NAME                        READY   STATUS    RESTARTS   AGE
catalogue-ccd859978-8qlrr   0/1     Running   0          6m6s
catalogue-ccd859978-bjnk7   0/1     Running   0          6m6s
catalogue-ccd859978-h4kl7   0/1     Running   0          6m6s
catalogue-ccd859978-hcxbv   0/1     Running   0          6m6s
catalogue-ccd859978-hqbvh   0/1     Running   0          6m6s
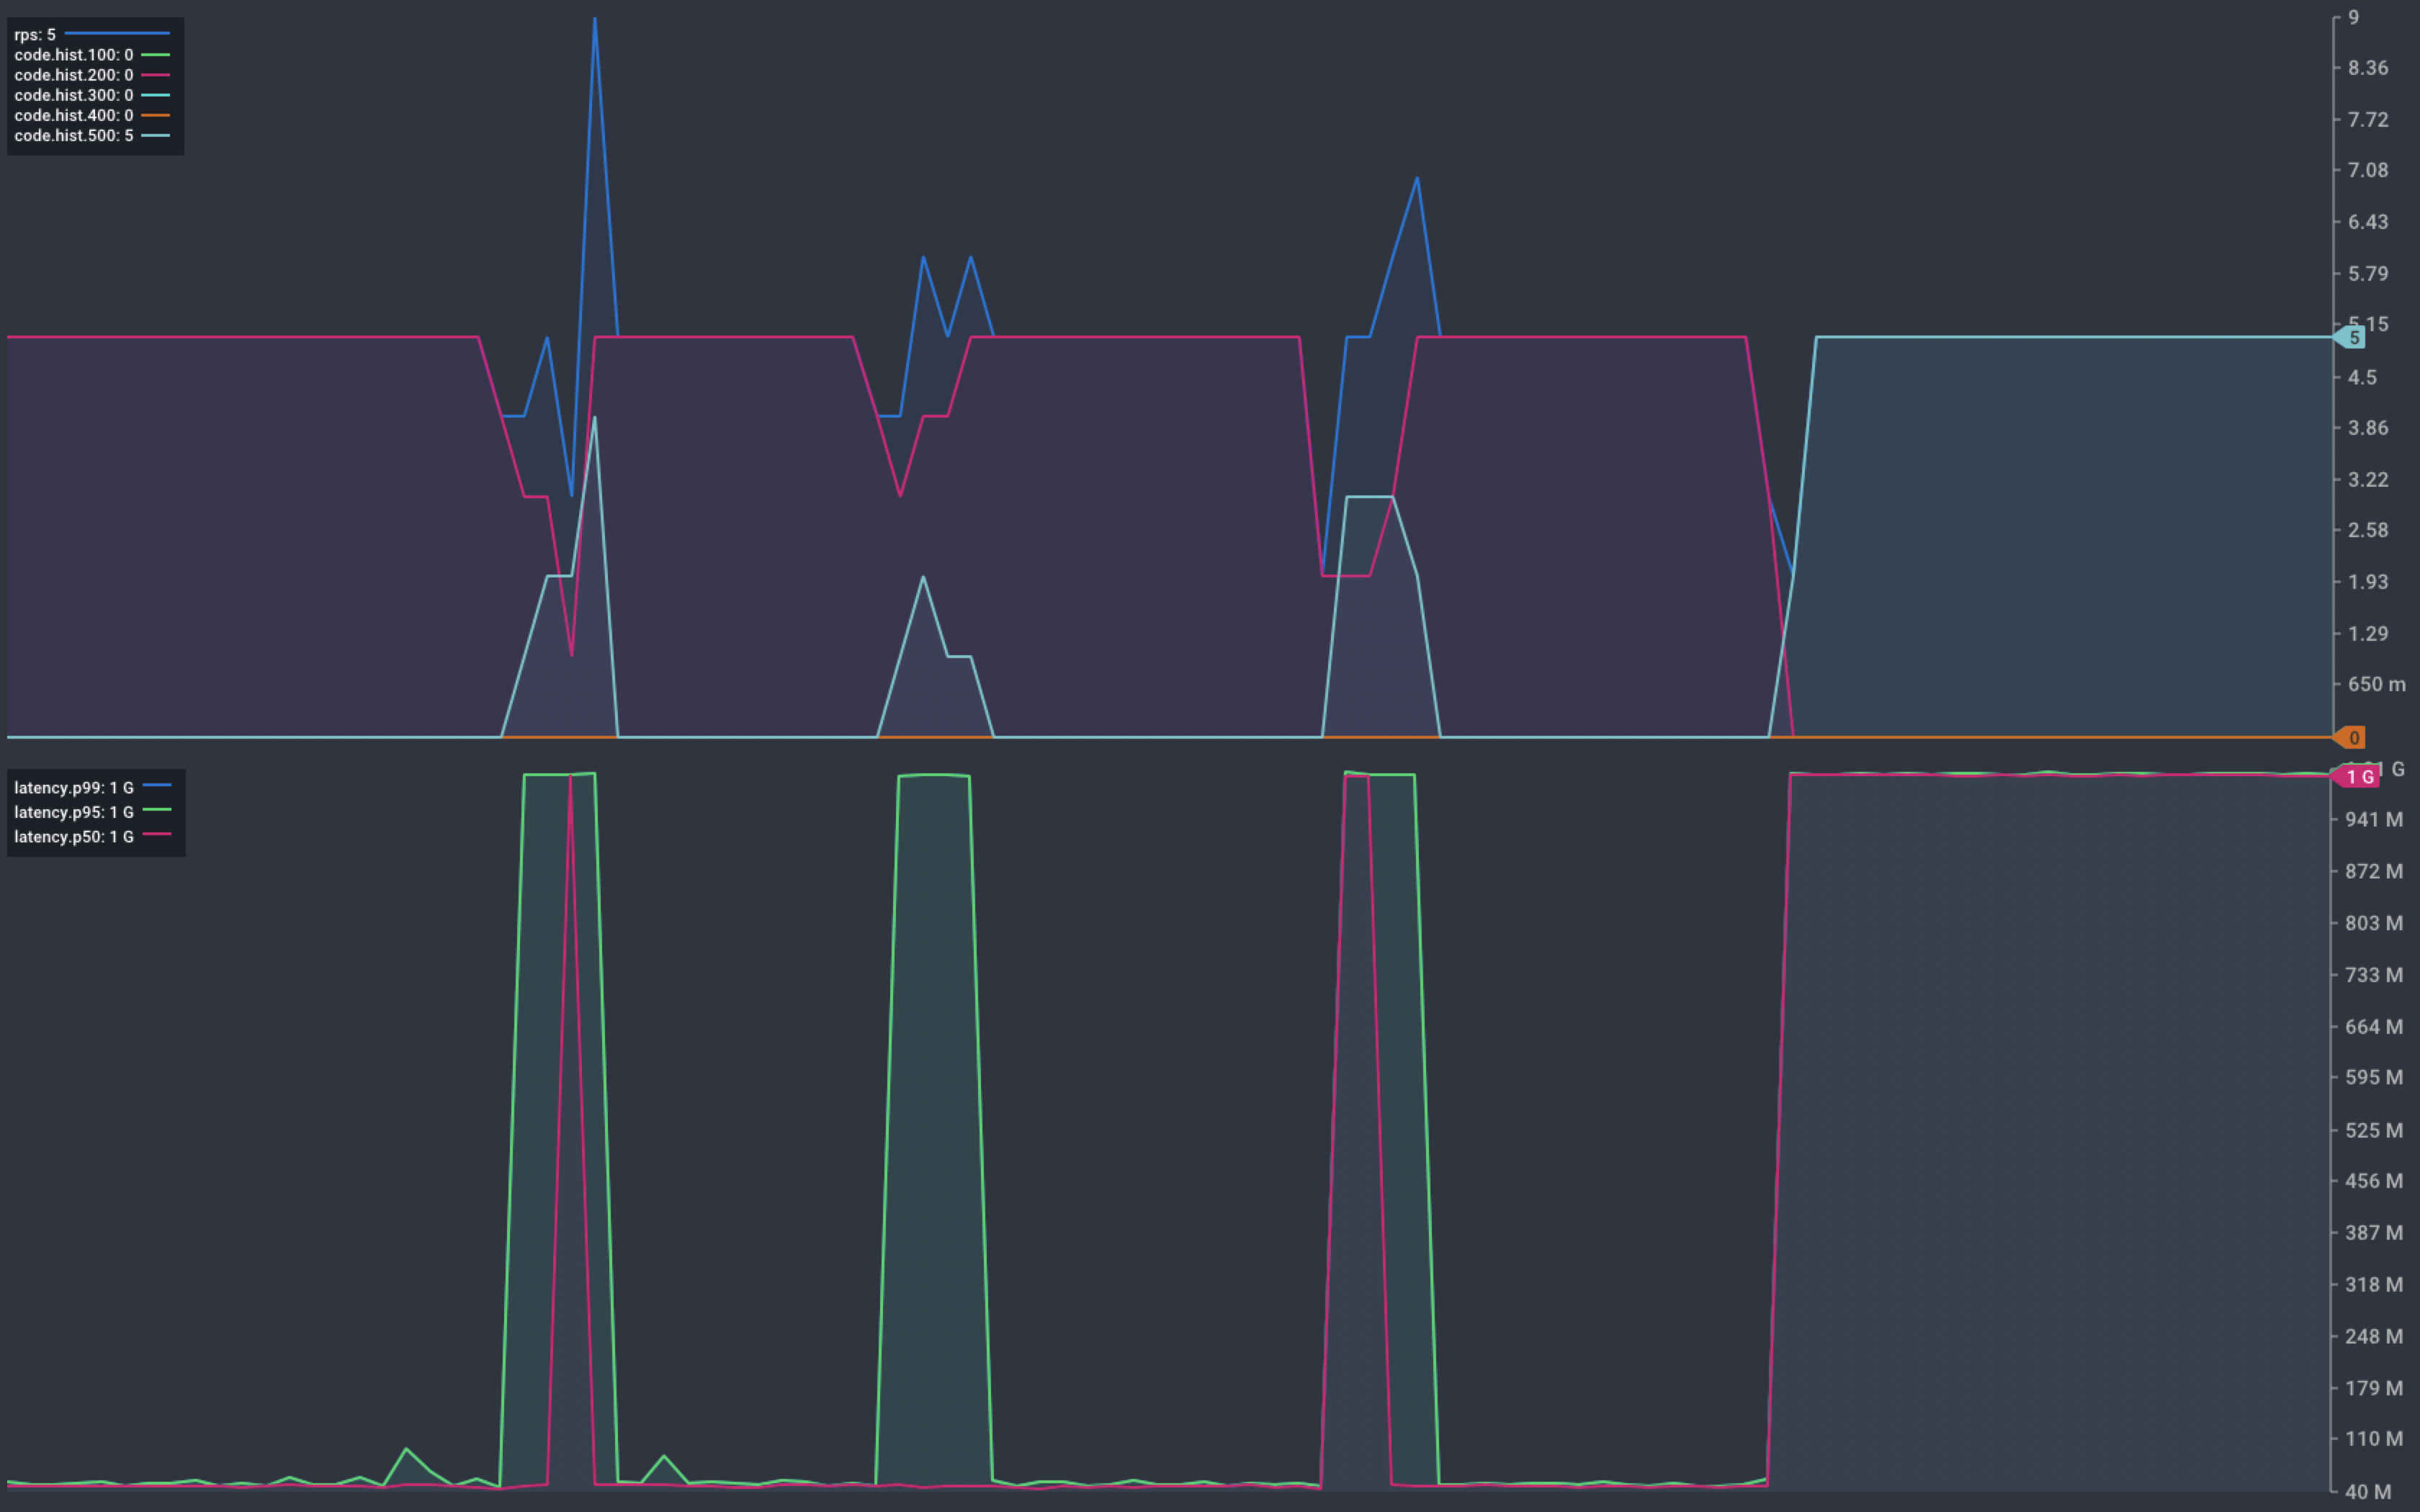
Chart showing response from our service during a hung container
The platform removes hung containers from service but fails to ensure desired capacity. This happens because the application process is still running. Even though it is unable to handle requests, the platform believes it is still running.
Crashed containers are no longer running and so the platform will start a new instance. Hung containers are still running, so the platform takes no further action.
In some cases, this may be the desired behaviour. In this example, the available capacity reduces by 20% each time a container hangs.
We can mitigate this by defining a Liveness probe. A liveness probe tells the platform whether our container is still alive.
---
apiVersion: apps/v1
kind: Deployment
metadata:
  name: catalogue
spec:
  replicas: 1
  selector:
    matchLabels:
      app: catalogue
  template:
    metadata:
      labels:
        app: catalogue
    spec:
      containers:
      - name: catalogue
        image: billglover/tanzu-store-catalogue:0.0.1
        imagePullPolicy: Always
        readinessProbe:
          httpGet:
            path: /healthz
            port: 8080
          initialDelaySeconds: 30
          periodSeconds: 1
        livenessProbe:
          httpGet:
            path: /healthz
            port: 8080
          initialDelaySeconds: 30
          periodSeconds: 1
          failureThreshold: 3
        ports:
        - containerPort: 8080
        env:
        - name: PORT
          value: "8080"
        - name: DELAY
          value: "10s"
        resources:
          limits:
            memory: "32Mi"
            cpu: "250m"
With a Liveness Probe defined, we again trigger our containers to hang.
k get pods
NAME                         READY   STATUS    RESTARTS   AGE
catalogue-8598797dcf-h6hbp   1/1     Running   0          2m58s
catalogue-8598797dcf-m698v   0/1     Running   1          2m58s
catalogue-8598797dcf-ns9n7   1/1     Running   0          2m58s
catalogue-8598797dcf-pdzpw   1/1     Running   0          2m58s
catalogue-8598797dcf-r9567   1/1     Running   0          3m26s
A second time.
k get pods
NAME                         READY   STATUS    RESTARTS   AGE
catalogue-8598797dcf-h6hbp   1/1     Running   0          3m2s
catalogue-8598797dcf-m698v   0/1     Running   1          3m2s
catalogue-8598797dcf-ns9n7   1/1     Running   0          3m2s
catalogue-8598797dcf-pdzpw   0/1     Running   1          3m2s
catalogue-8598797dcf-r9567   1/1     Running   0          3m30s
With our liveness probe in place, the platform detects and restarts hung containers. The only failed transactions we see occur during the detection window. The platform promptly restores capacity to 100%.
Chart showing response from our service during a hung container
Can we do better?
We have seen how probes provide platforms with vital information on container health. During the detection window, failed transactions can still occur. Is there more we can do to mitigate the impact of these?
It becomes increasingly complex to reduce the possibility of a single transaction failure. In scenarios such as this, it is common to look to the client application to mitigate low failure rates. Can the client retry the request? Does the number of failures fit within our Service Level Objective (SLO)? Considerations such as these can reduce the need to add complexity into the platform.
But can we go too far? Both liveness and readiness probes accept configuration parameters:
initialDelaySecondsperiodSecondstimeoutSecondssuccessThresholdfailureThreshold
It is important to consider how these impact the behaviour of the probe.
We also get to decide how our containers respond to a probe. Under what conditions do they report ‘ready’ or ‘alive’. This is a complex topic, and configuration will very much depend on your application. This blog post by Colin Breck is a good starting point for avoiding some common pitfalls: Kubernetes Liveness and Readiness Probes: How to Avoid Shooting Yourself in the Foot
Building Cloud Native Applications
Platforms provide a good foundation onto which we can deploy our applications. But in our rush to adopt the latest and greatest, we often forget the basics. Platforms can only make crude assumptions about the health of our applications. In reality, it is the developers who are best placed to articulate application health. Health probes give them the ability to expose this information to the platform.
This holds true for other features promised by modern platforms. Your applications get very little for free. They don’t inherit configuration management without consideration for how to use it. They don’t become secure because we deploy them on Kubernetes. Kubernetes doesn’t work wonders if your applications are not designed to scale out. Deploying on top of a platform is not enough. You need to design (or transform) your applications to capitalise on platform capabilities. This is what it means to build Cloud Native Applications.
A good starting point are the 12 Factors (12factor.net). With no mention of liveness or readiness probes, this list is not comprehensive. Additionally, you don’t need to adopt every factor to enjoy a modern platform. If you understand the significance of each factor you are on the way to good Cloud Native design.
Building Cloud Native Applications requires a degree of understanding of the underlying platforms. This understanding comes with experience. Above all, before depending on platform capabilities, test and confirm they deliver. Remember, service availability is your concern. When things go wrong, it’s not acceptable to point the finger at the platform and shrug.