The Power of Logs
A few years ago, I did some work for an online retailer. The systems were complex. Over the years, the business had layered an online presence atop of systems built to serve the needs of disconnected physical stores. Change was hard. Despite this complexity, the data used to assess eCommerce performance were remarkably simple. Most prominent were the Requests Per Second (RPS) served by the web servers. Traffic patterns were so predictable that morning dips, lunchtime spikes and absolute numbers were all familiar to the business.
As we sought to introduce additional features for customers, we needed to understand more about this data. What did it include and what did it exclude? How sensitive were the business to changes in the absolute numbers presented? The how was quick to uncover; shell scripts, regular expressions, and log files. The what is far more nuanced.
- Did we include both static and dynamic pages?
- Did we exclude known bots or scrapers?
- Were they counted before or after one of the many caching tiers?
- How was data aggregated or grouped?
Answering these questions, and trying to explain the observed behaviours taught me the power of log processing using awk, sed, zcat and zgrep. Regular expressions quickly found their place in my list of essential tools. But our team quickly became a bottleneck, and scripts became unwieldily. We couldn’t keep up with the desire to query the data. It wasn’t long before we turned to new tools for help.
But new tools came with an unexpected challenge. Recreating the existing metrics using a new log processing pipeline was a genuine challenge.
Once a metric makes its way onto an office dashboard, it becomes impossible to change.
The business was more sensitive to the existing metrics than I’d realised. It didn’t matter how many bugs or inconsistencies we could fix with new tooling, accuracy wasn’t the focus, it was consistency.
I left this project convinced that logs held the answer to more questions than the business knew to ask. With log files and a few shell scripts, it was possible to answer questions around order sizes, average items in baskets, the value of missed sales, etc. But shell scripts come with a high barrier to entry and don’t scale with the organisational thirst for insight.
The Power of Search
On another project, logs were again the source of application insight. This time, we ingested all logs into a search index. This allowed for a richer, more accessible query language. We had dashboards, reports, and template queries. But there was still a barrier to entry: When presented with a search box, you need to decide what to search for. For example; to find out how many customers had opened a mortgage account, you’d count the number of times the APIs had responded with a HTTP 2xx response code. You’d then have to filter out any synthetic messages from the result set.
This still required a user to have significant architectural and behavioural knowledge before they could write an effective query. With a flow as complex as mortgage registration with multiple service calls, it quickly becomes difficult to know which requests to include and which to exclude in the metrics. It wasn’t long before we introduced logging changes to enhance the insight we had into the system. We began by switching to structured logging, making it easier to write search queries and aggregate information. Before long we were seeing regular changes to our logging framework to add additional fields, correlation identifiers, etc.
As load increased, log performance became an issue. First it was the ability to index the logs themselves, then it was the performance impact of writing the logs out of the application, and then it was the performance of regular expressions looking for and masking sensitive data that had inadvertently made its way into the log pipeline.
As our logging infrastructure became increasingly difficult to manage several things stood out:
- Logs are an untapped goldmine of information about your business.
- The ability to infer business metrics from log lines requires you to log for both success and failure.
- Engineers typically log for failure rather than success. We see the absence of logs as a positive thing.
- Correlating log lines across systems is powerful, but queries quickly become difficult to write.
- Demand for new insight will cause engineers to make code changes to their applications. There is no tool that magically captures the data to answer all the questions the business will ask.
Although we’d come a long way from our time with sed and awk, there was still room for improvement.
The Power of Metrics
Logs describe events. The format of a log message can vary, but it is inherently descriptive. By introducing structure, we can capture quantitive data about the events they describe. This flexibility is powerful, but it brings with it several scaling challenges.
- Are we using consistent time formats / time zones?
- Are we using consistent language?
- Do we have meaningful correlation identifiers for all log lines?
These go beyond the storage and computation costs associated with log management and extend into the burden teams take on to ensure that they log data consistently across applications. It was time to explore metrics.
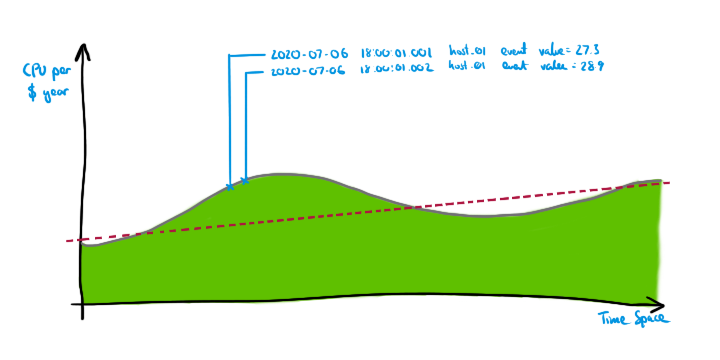
In its simplest form, a metric captures a numeric value at a specific point in time. Often stored as part of a named time-series, we can associate additional properties to the series; e.g. source, app, etc. We use metrics to track how a numeric value changes over time:
- free memory
- disk utilisation
- temperature
But, just like log entries, we can also use metrics to represent events. Importantly, these events don’t have to be technical, they can be business domain events:
- request received
- order placed
- failed logon
This similarity between logs and metrics can lead to confusion and the resulting question; metrics or logs? So what is the difference?
“Due to their lightweight structure and numeric nature, metrics lend themselves to many mathematical transformations including aggregation, correlations, distributions/histograms, and many others. – Stela Udovicic, Wavefront
The ability to aggregate and correlate metrics can provide real insight into system behaviour. The ability to look at distributions over time can provide invaluable information around trends in system performance.
Whilst it is possible to embed numeric information in log entries, query performance drops off quickly as you add numeric computation to your results. First, we need to parse log entries into a common data structure, we need to handle exceptions and edge cases, only then can we begin aggregation and statistical analysis. This is relatively straightforward for simple queries, but as you try to query across log formats things get unwieldy.
So metrics are better, right? Well, not quite. Before you drop your logs and go all in on metrics, remember, the descriptive nature of a log message often provides the insight you need to understand why an application behaved the way it did. Metrics won’t capture your stack-traces. They won’t capture the internal errors from a framework or library. Metrics don’t allow developers to hint at any correcting action. To capture these logs have you covered. I believe this shouldn’t be a debate on logs vs metrics. It isn’t either/or. As system complexity increases, there is a powerful use case for both logs and metrics. For a more in-depth look at logs and metrics, I’d recommend Cindy Sridharan’s excellent piece on Logs and Metrics.
Developer Experience
So far we’ve looked at logs and metrics from the perspective of the consumer and seen some challenges faced when trying to gain insight into your systems. But there is another perspective that is worth considering; the experience of the developer. Logging comes second nature to many developers. Good logging takes some experience. But, despite recent popularity, capturing metrics still takes more effort.
In the next couple of posts, I will use Tanzu Observability by Wavefront to explore the what it takes to add metrics and tracing to two Go applications.
- Part 1: Logging & Metrics: It’s a Journey (this post)
- Part 2: Instrument Go applications with Wavefront
- Part 3: Add tracing to your Go application with Wavefront (coming soon)