In the Part One of this series, I looked back at my experience with using application logs to gain insight into application and system performance. Despite the wealth of information these logs contain, much of it goes untapped. The advent of log analytics saw a step change in the information we were able to retrieve from his goldmine of untapped data. This served as a catalyst, prompting both development teams and businesses to demand more insight from their applications. But this didn’t come without challenges. The performance challenges and the coordination required to reliably obtain business metrics from log-based solutions are not insignificant. This has given rise to a new era in observability, the era of the metric.
In this post, I take an existing application, written in Go, and use Wavefront to capture custom metrics. If you’d prefer a video walkthrough, jump to the end of the post.
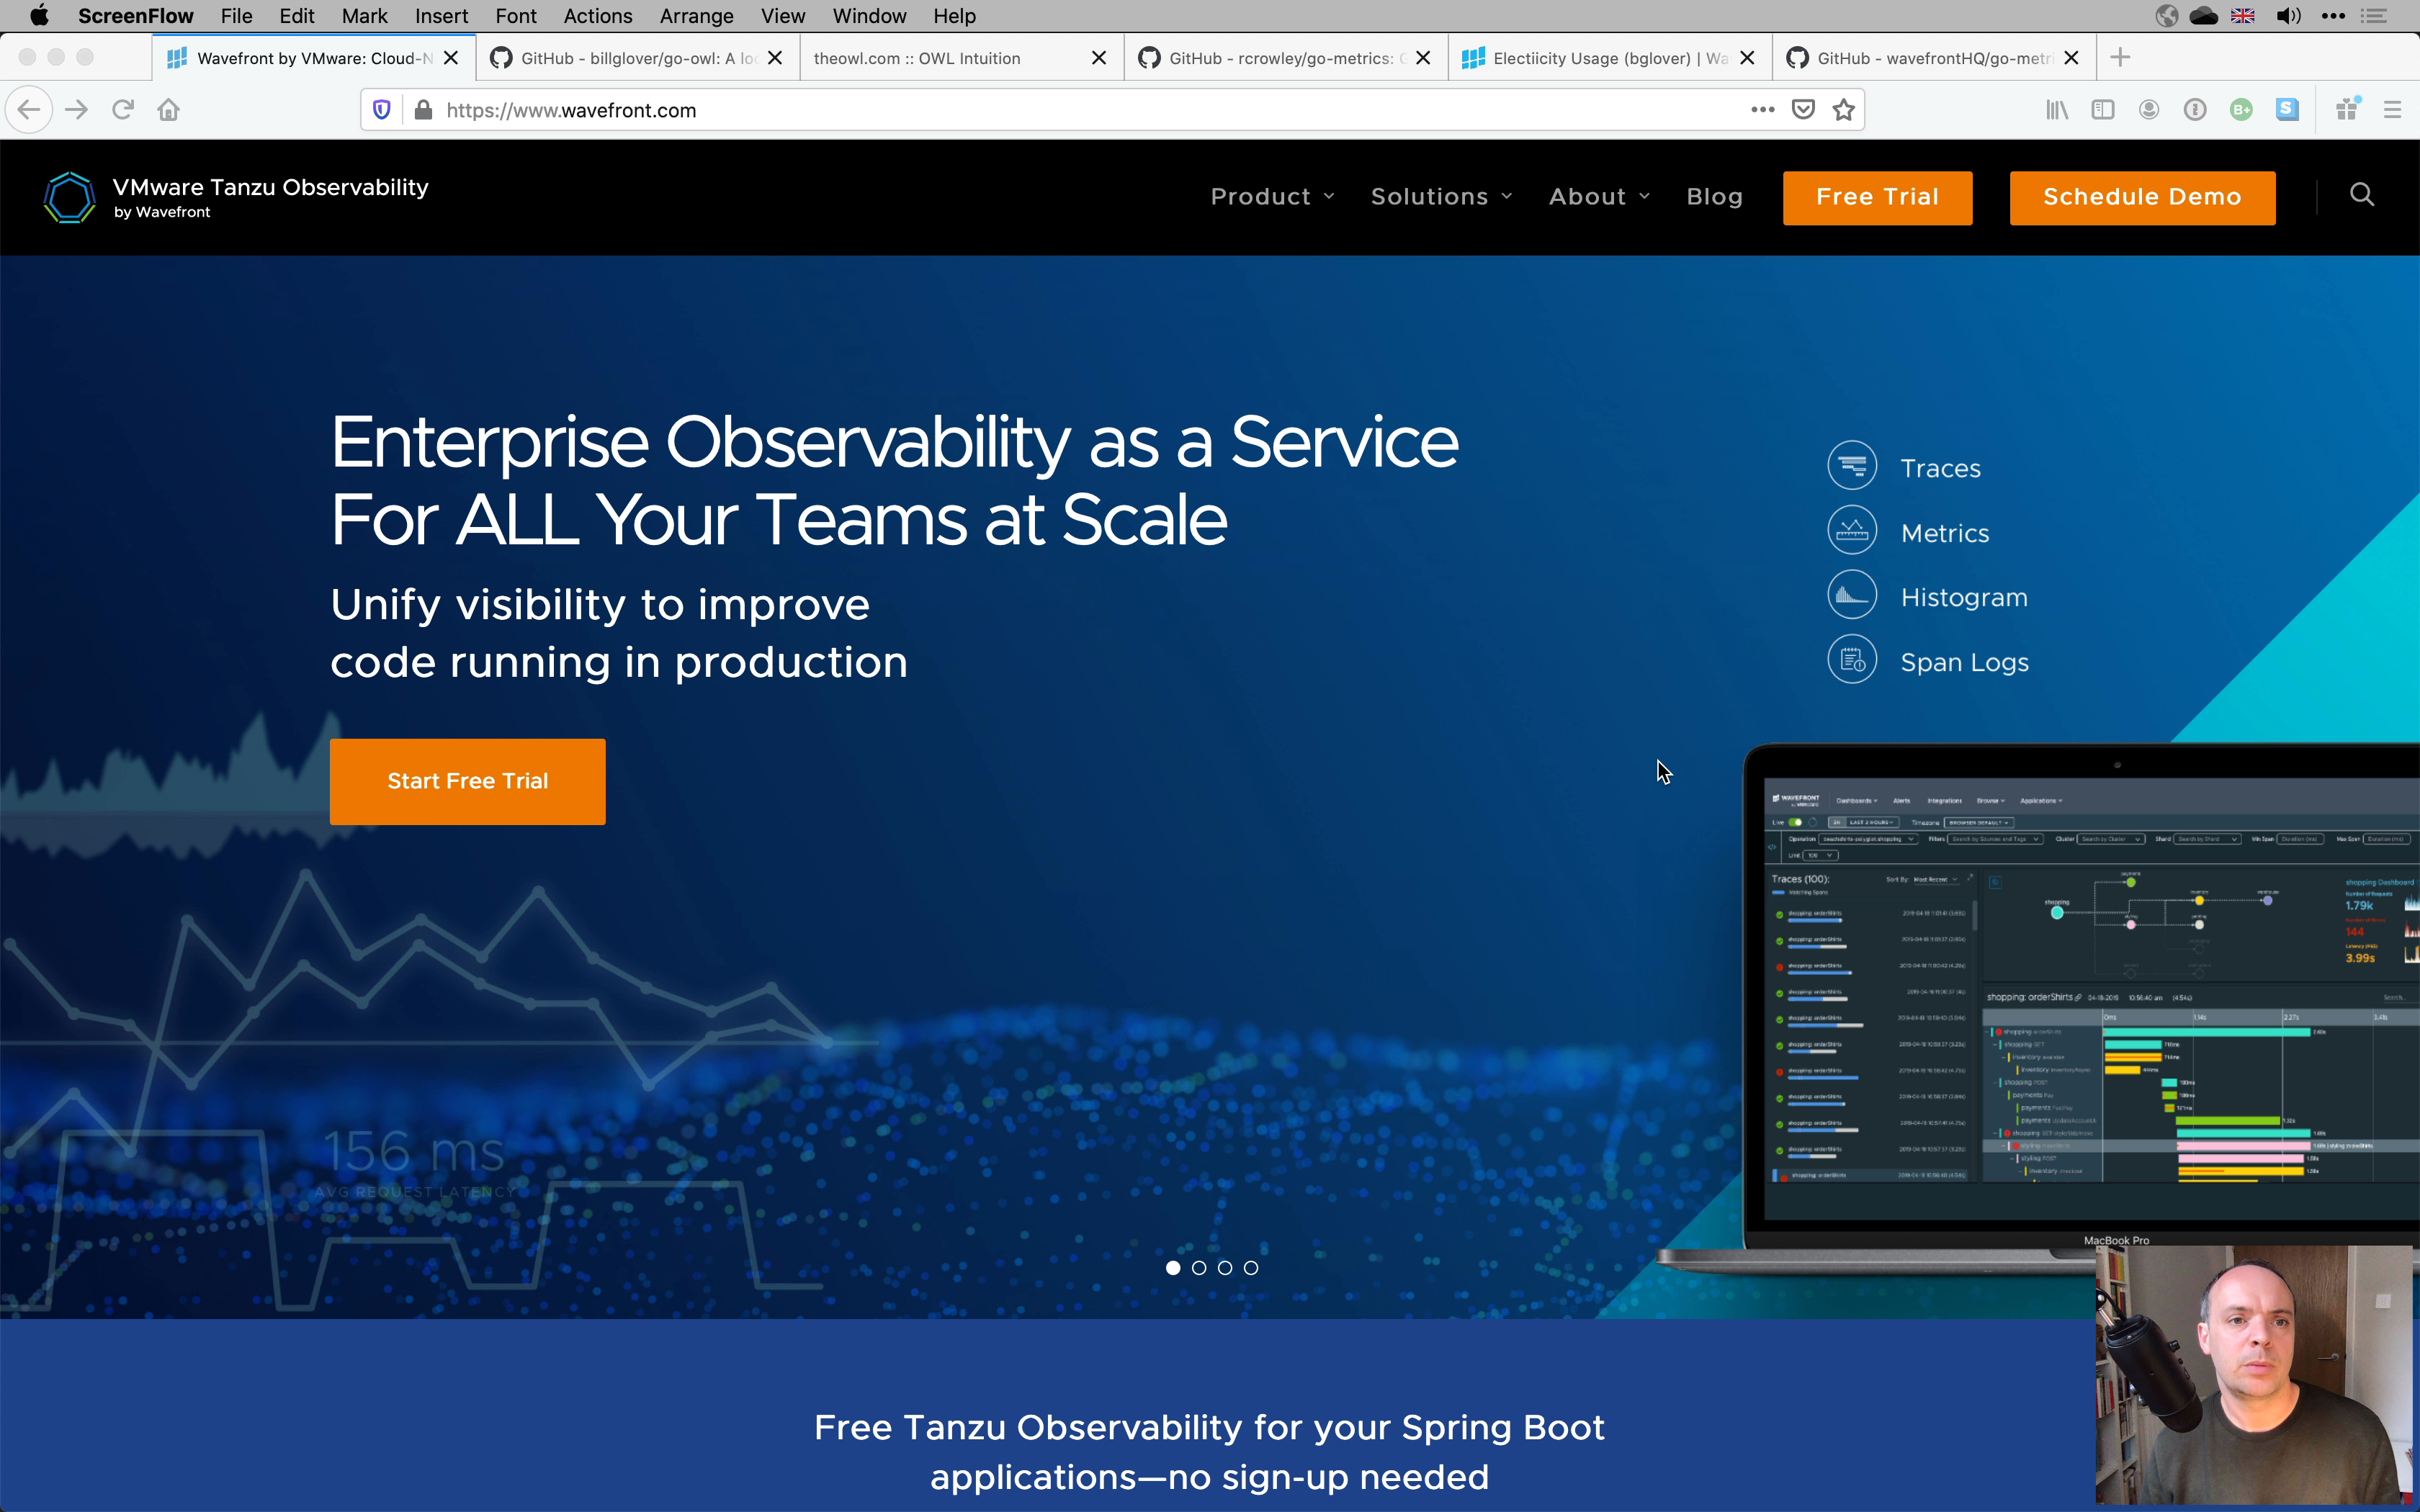
Tanzu Observability by Wavefront
Wavefront provides enterprise-ready Kubernetes monitoring and observability. With over 200 integrations for popular applications, tools and frameworks, the chances are you can get up and running quickly.
The Wavefront data model centres on three concepts.
- metrics - a time series of data points; e.g. counters, gauges, etc.
- histograms - distributions of metrics (rather than single values)
- traces - capture how requests flow through a system
Combined with a powerful query language and graphical dashboards these concepts provide the tools you need gain real insights into your applications and platforms.
Metric data can come from anywhere. Integration with a web server such as NGINX generates metrics around requests, error rates, durations, and more. You could integrate with MongoDB to provide insight into database performance.
But the real power in metrics is the ability to capture custom, business relevant data points. I believe this is where Wavefront really shines.
- successful orders
- stock misses
- order values
- user registrations
- delivery slots
- etc.
These are all custom metrics that speak directly to your business. With custom metrics, you are no longer constrained to using technical indicators as a proxy for a business event.
It is your development teams who are best placed to understand the goal of your application and the insight required to measure the value it offers to the business. Wavefront enables developers to expose this insight alongside the traditional technical indicators of system health.
In the rest of this post, I will show how to take an existing application, written in Go, add some custom metrics. I’ll show you how to send these to Wavefront and provide an example dashboard showing how they can be displayed.
Instrumenting a Go application
Some years ago I built an application that listens for UDP packets broadcast by my electricity meter. The application decodes these packets and logs the current power consumption to the console.
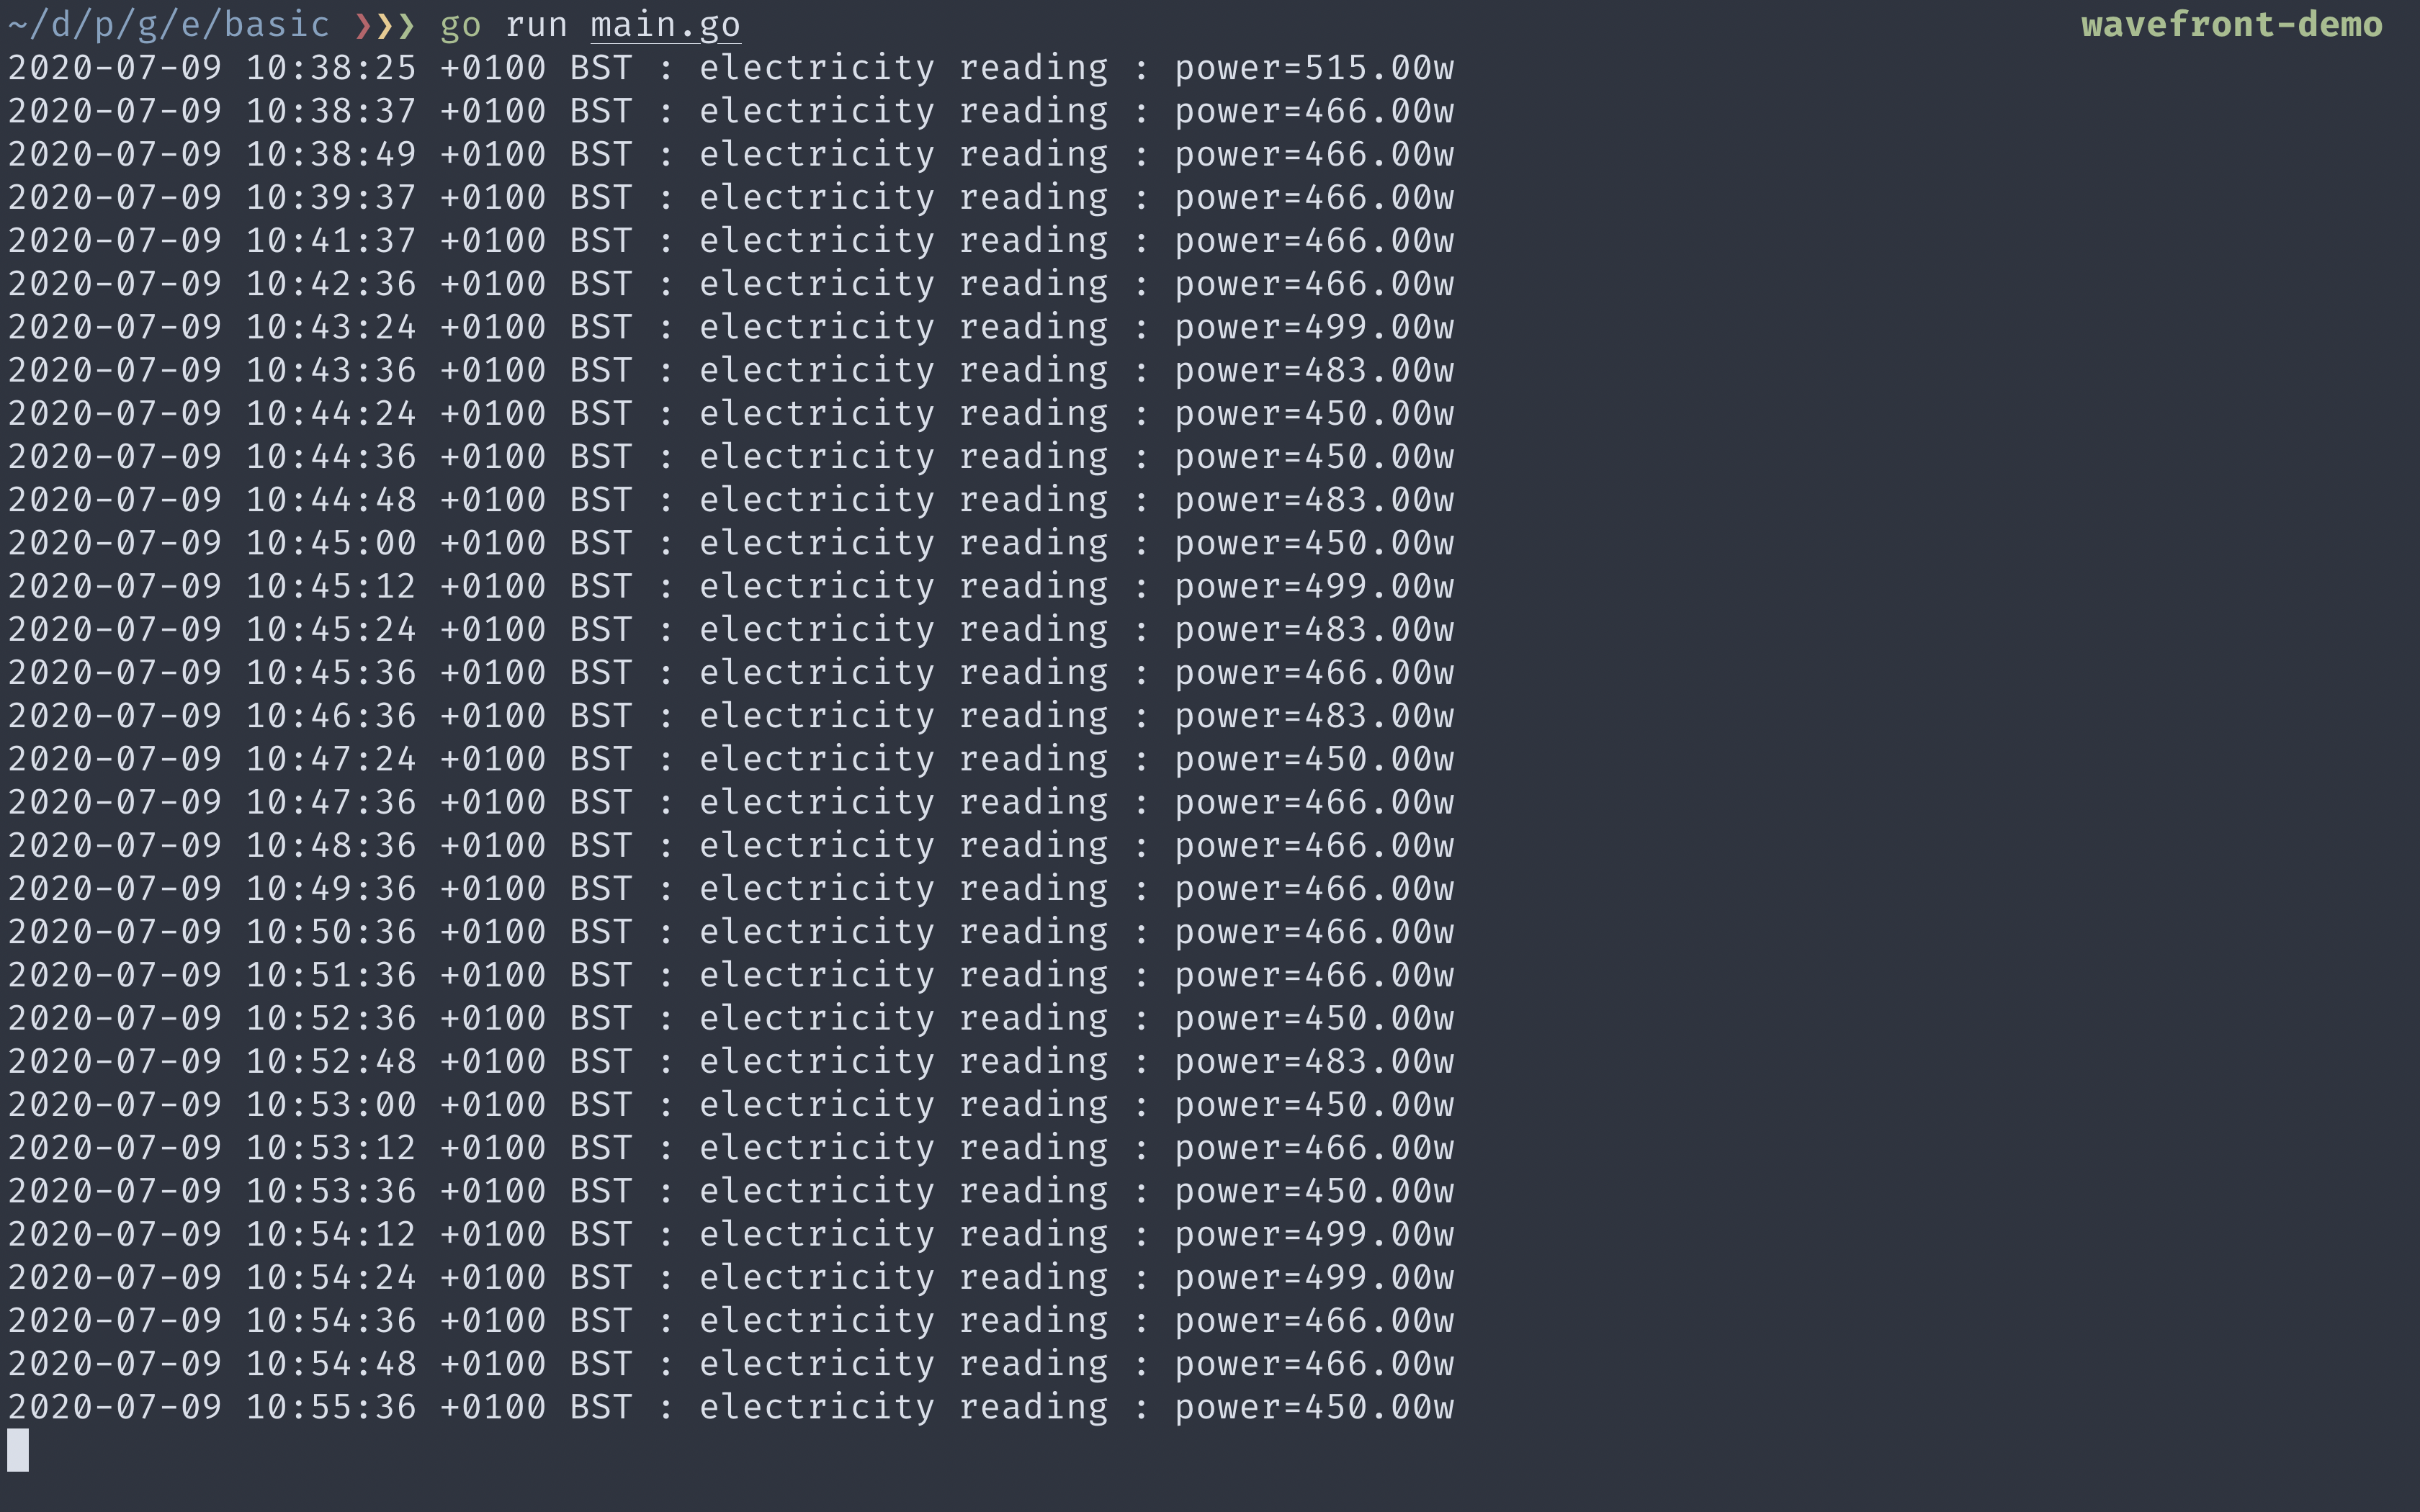
This is an example of the application today. This information isn’t particularly useful on the console and, unsurprisingly, I never look at it. We are going to use this application as a starting point and show how the use of custom metrics can bring this data to life.
- Sign up for a Wavefront account
- Generate an API token
- Create a Sender for Wavefront
- Create a Reporter for Wavefront
- Add some custom metrics
- View your data, build dashboards, etc.
A quick reminder: If you’d prefer a video walkthrough, jump to the end of the post.
Sign-Up for Wavefront
If you’d like to see how easy it is to add metrics and instrument your own application, Wavefront offers a free trial. If you are a Spring Boot user, you get a head start and access to the free tier.
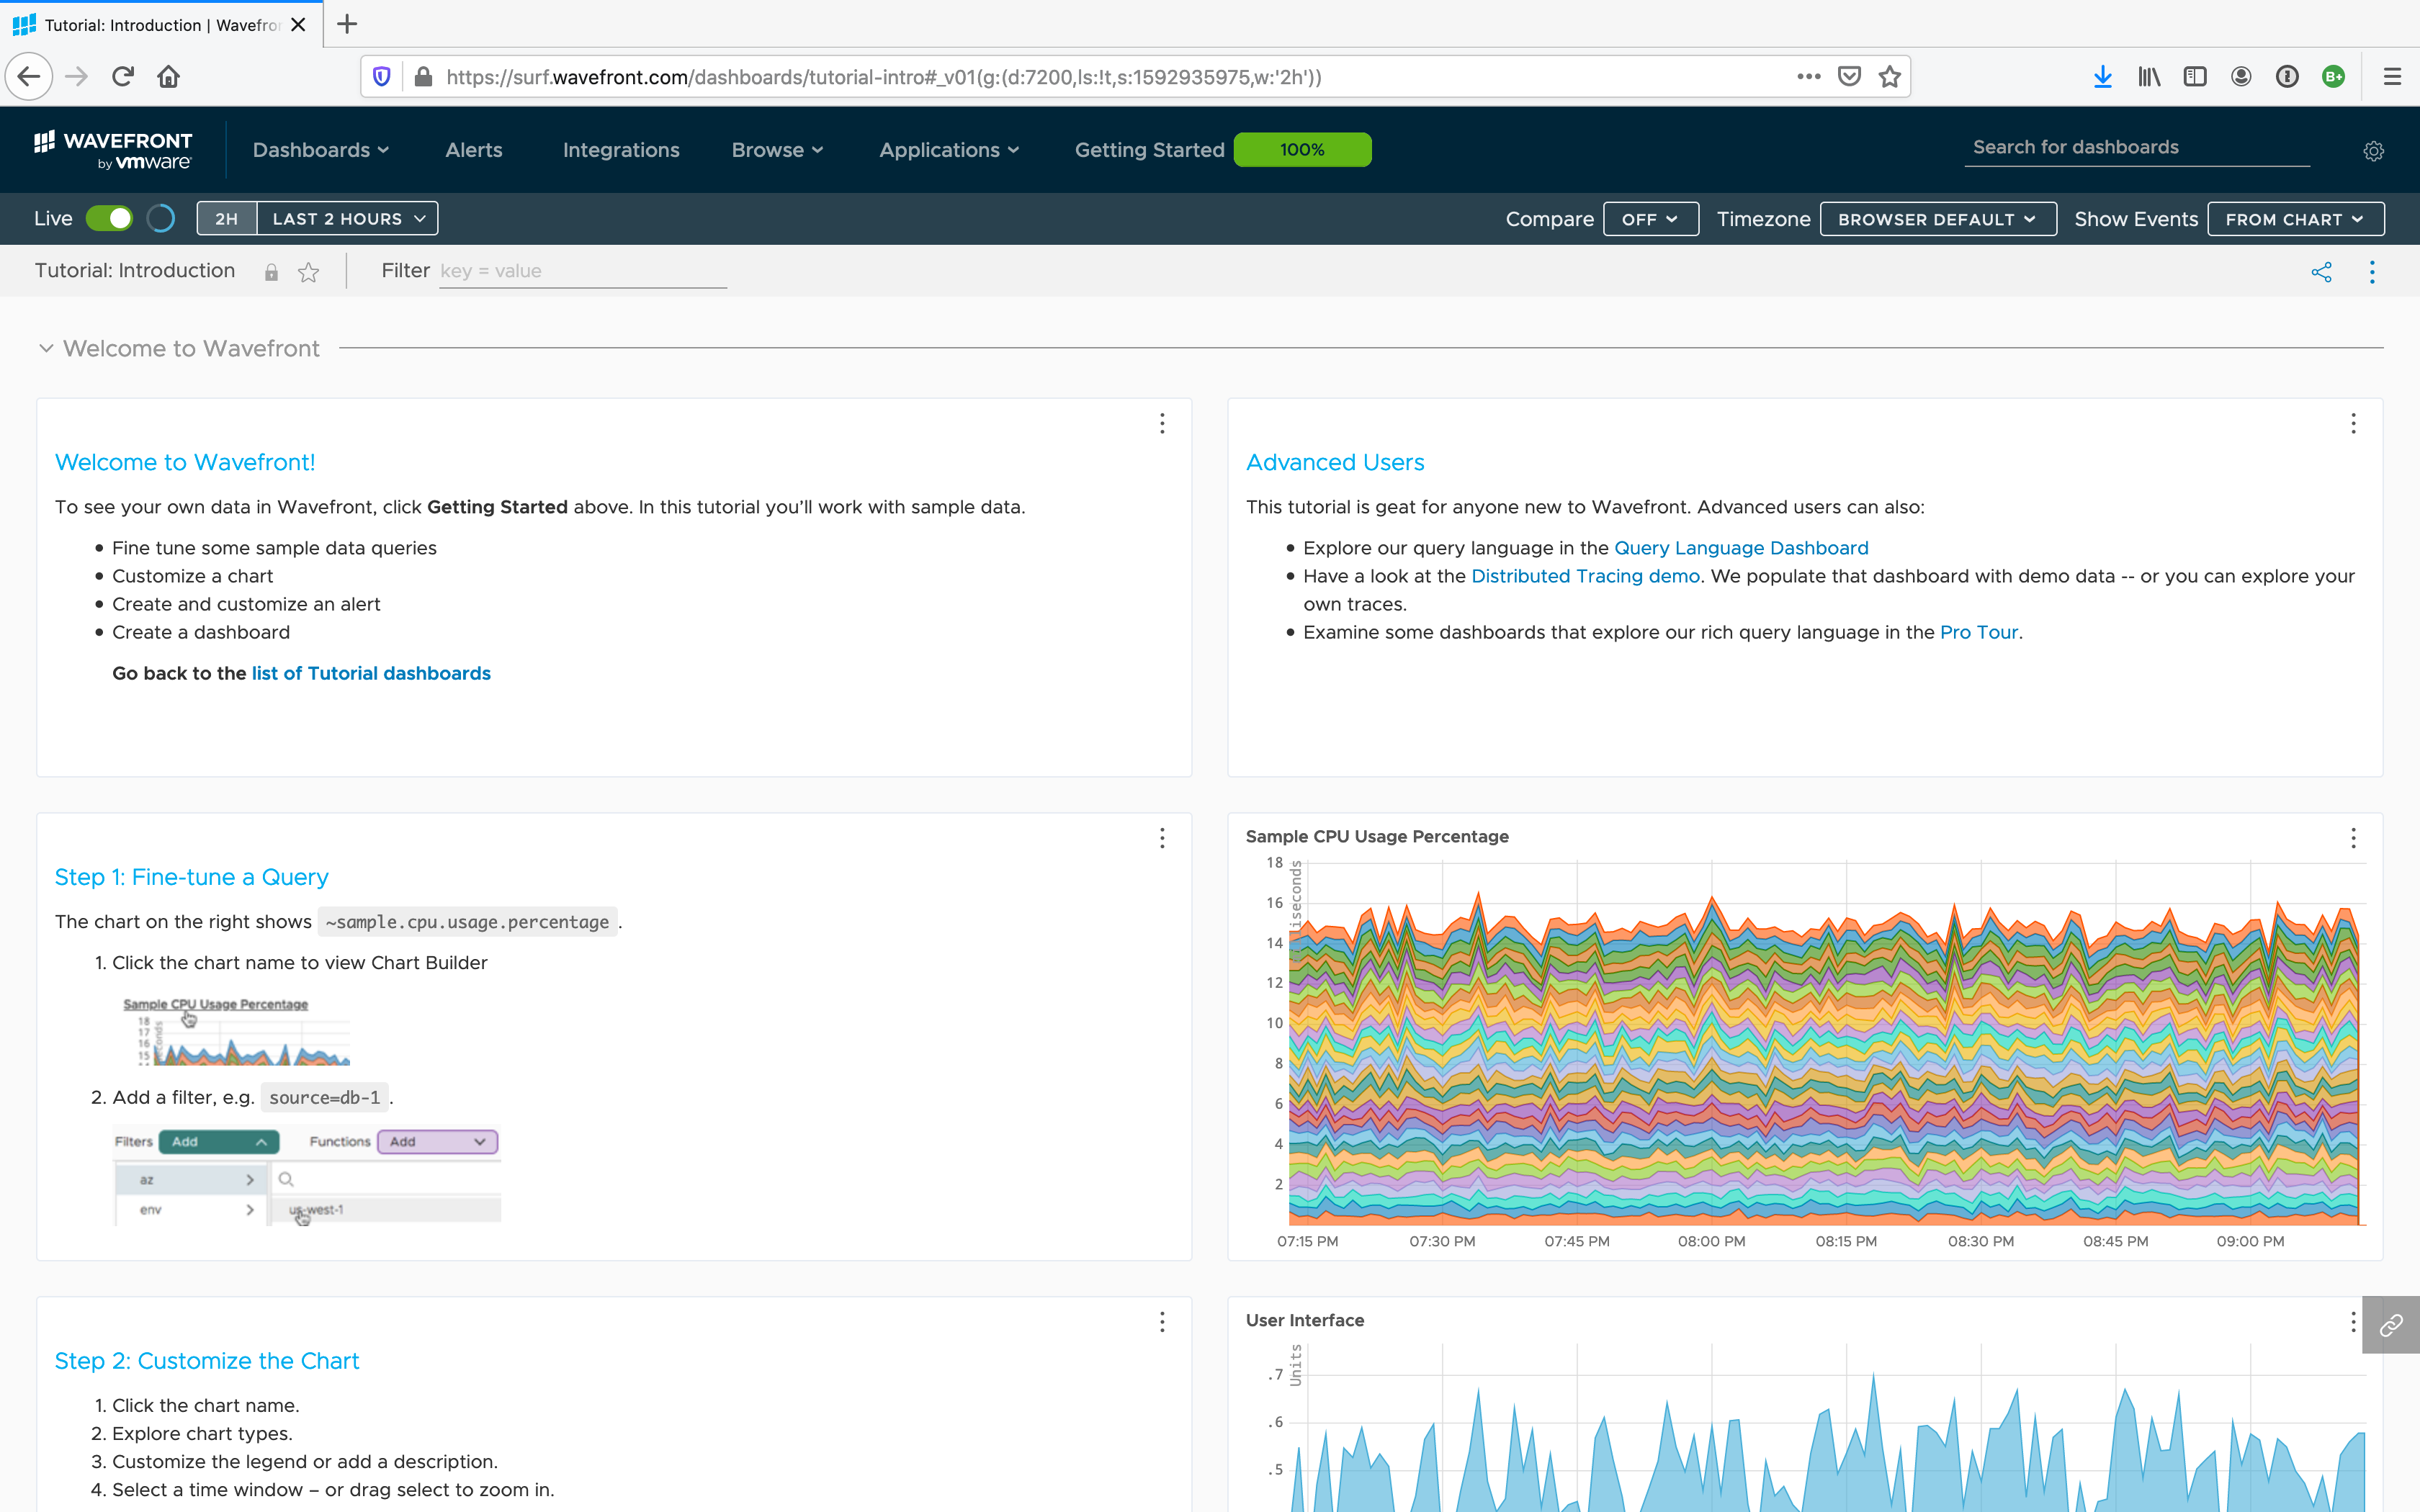
When you sign-up you are given a quick tour, you can skip this if you just want to jump in and start exploring.
Get your API Token
You’ll need an API token to authenticate your application with Wavefront. Log in and access your account settings by clicking the settings icon in the top right. Click on the API Access tab and create yourself an API token.
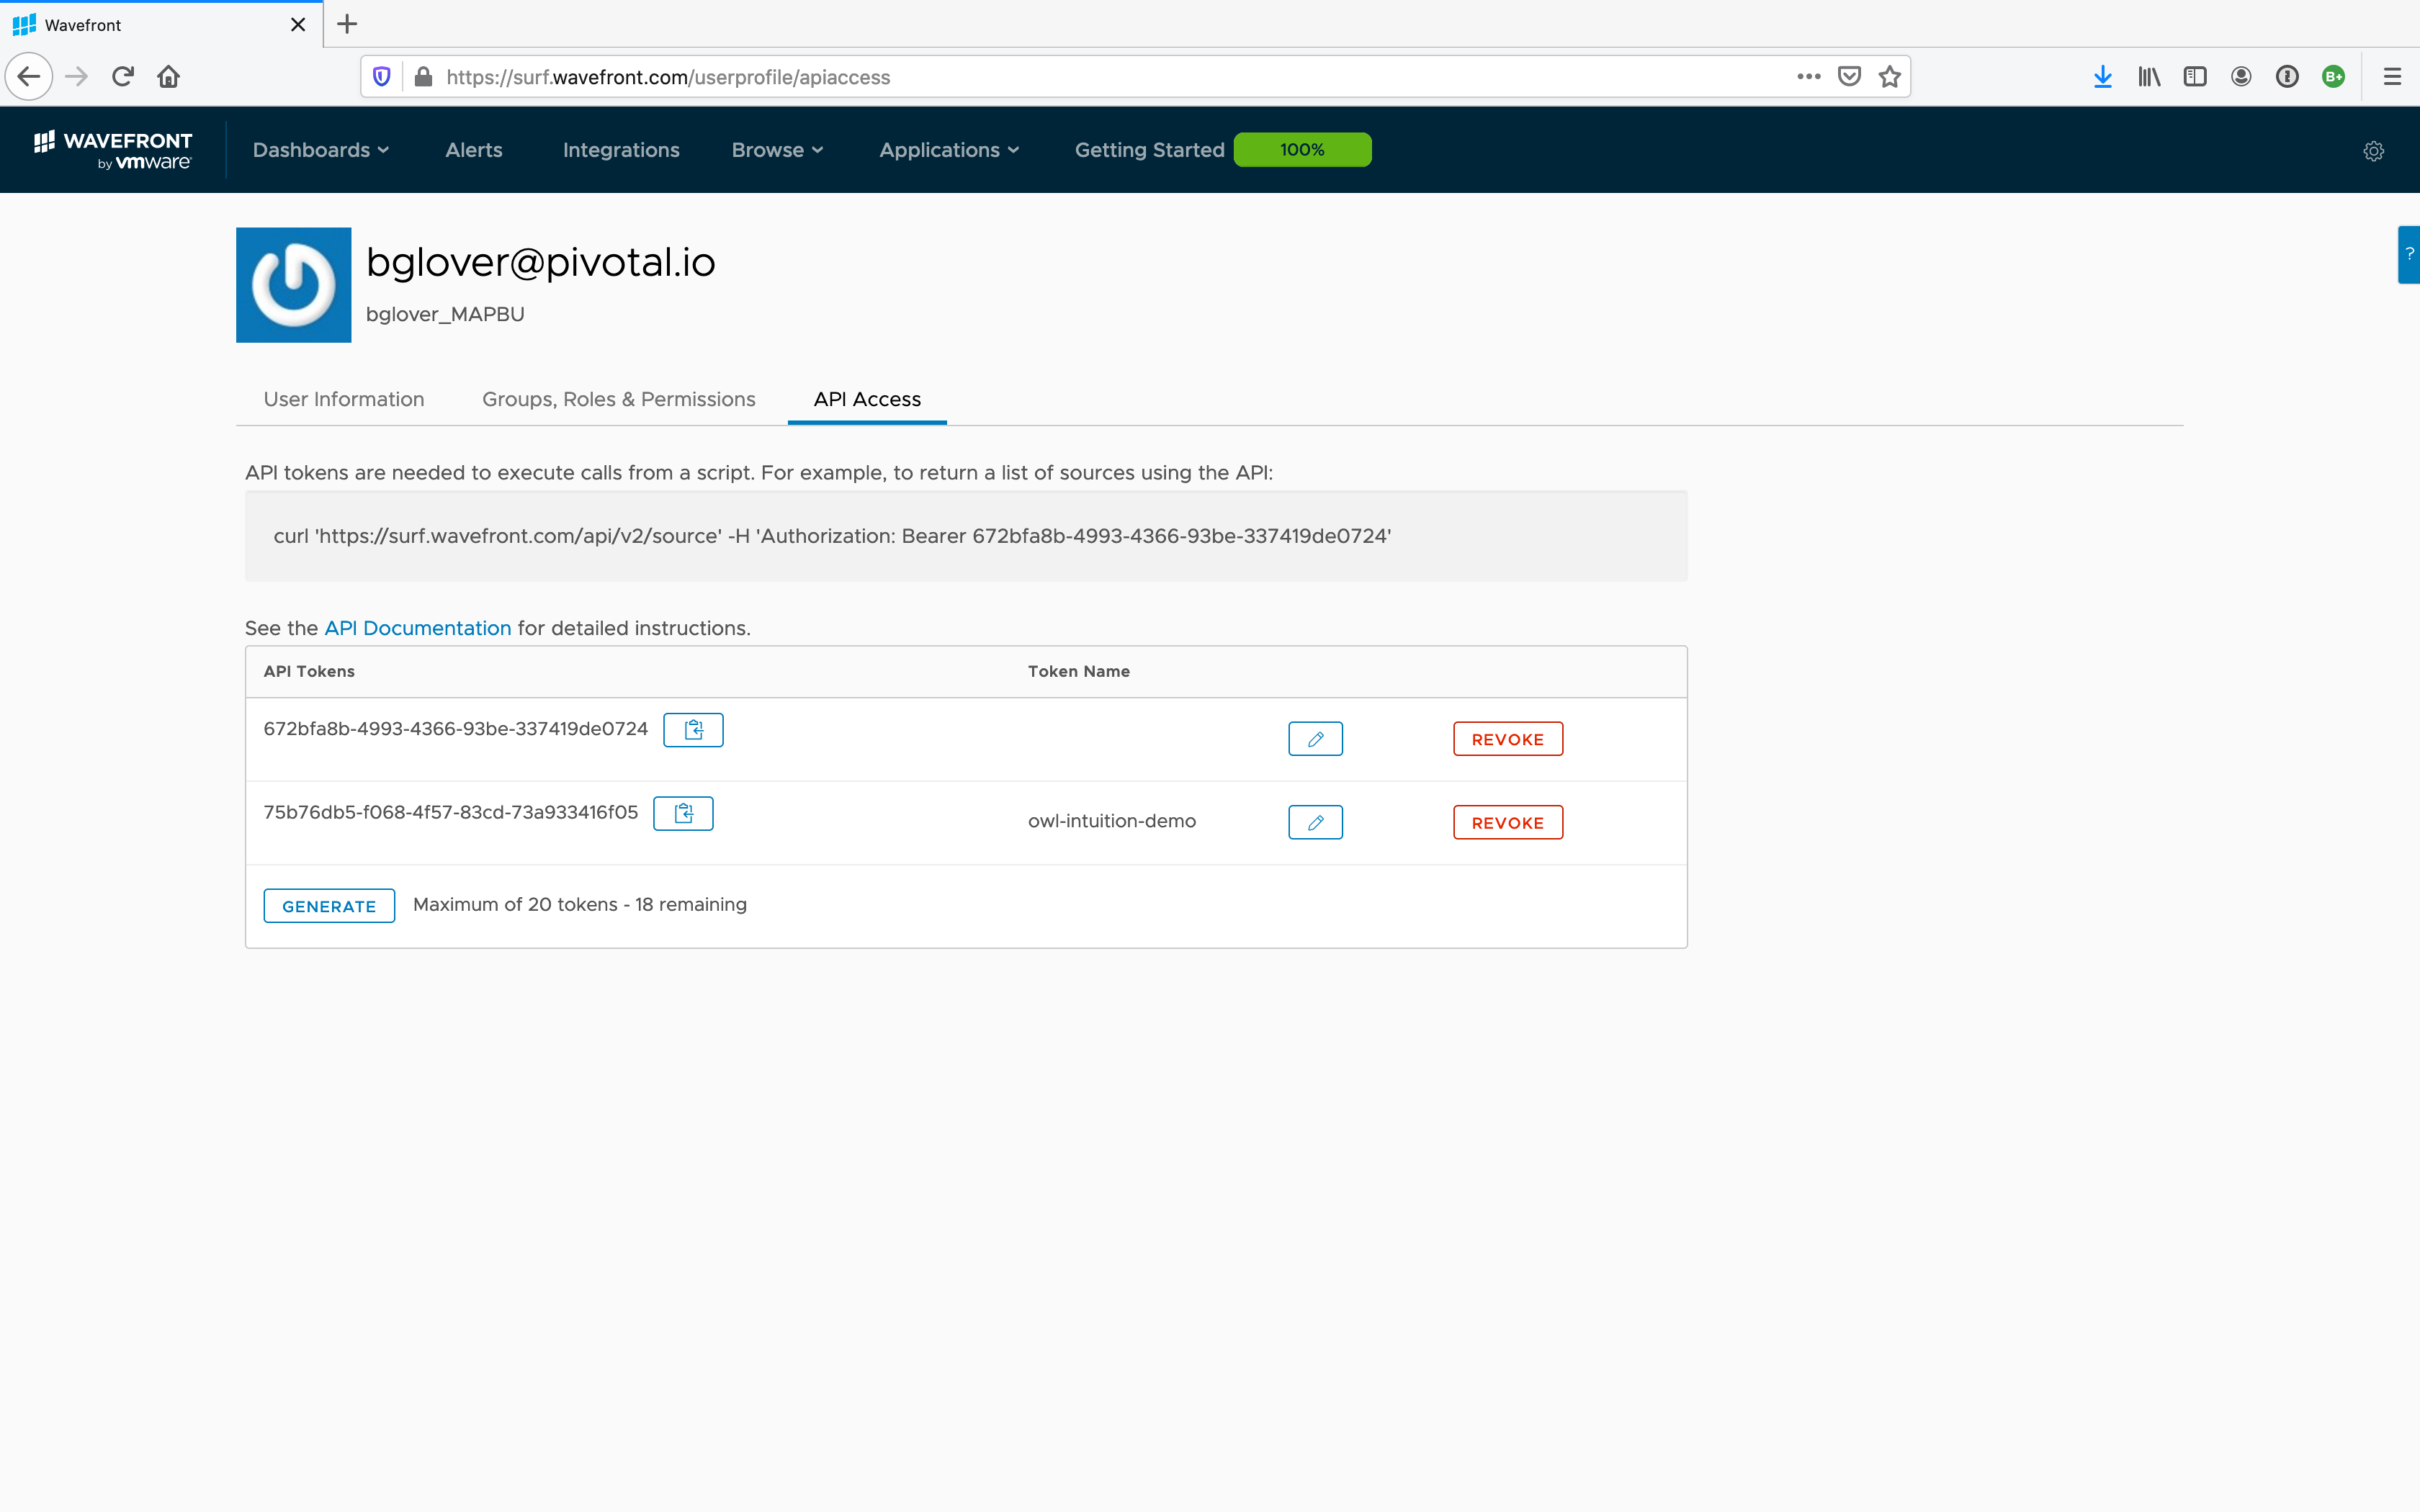
Don’t worry, I’ve revoked the tokens shown here. 😉
I use an environment variable to make the token available to my application, but you could present this as a flag, or read it from a file. I don’t recommend storing it in your source code.
token := os.Getenv("WF_TOKEN")
if token == "" {
	fmt.Fprintln(os.Stderr, "set WF_TOKEN to provide a token")
	os.Exit(1)
}
Create the Wavefront Sender
The Wavefront SDK provides a few packages for Go developers. We’ll be using the three below:
- wavefronthq/wavefront-sdk-go/senders
- wavefronthq/wavefront-sdk-go/application
- wavefronthq/go-metrics-wavefront/reporting
The sender package Sender interface which specifies the methods needed for sending metrics, distributions and spans to Wavefront. It also provides two implementations of this interface:
- A
ProxySender— used when sending metrics to Wavefront using Proxy Ingestion. - A
DirectSender— used when sending metrics to Wavefront using Direct Ingestion.
For getting started quickly, Direct Ingestion is perfect. For a more robust set-up, Proxy Ingestion provides several important benefits including; a single point of egress, buffering and bandwidth optimisation, filtering, etc. We will use Direct Ingestion just to get things up and running.
To configure the Direct Sender, you need to pass the URL of your Wavefront instance and your API token.
cfg := &senders.DirectConfiguration{
	Server: "https://surf.wavefront.com",
	Token:  token,
}

sender, err := senders.NewDirectSender(cfg)
if err != nil {
	fmt.Println(err)
	os.Exit(1)
}
Create the Wavefront Reporter
The Wavefront Reporter takes our metrics and wraps them in some additional metadata before passing them to the Sender to deliver to Wavefront.
reporter := reporting.NewReporter(
	sender,
	application.New("owl", "electricity"),
	reporting.Source("owl.internal.glvr.io"),
	reporting.Prefix("owl.monitor"),
	reporting.LogErrors(true),
	reporting.RuntimeMetric(true),
)
The reporter takes two required parameters; the sender and the application tags. We use a helper method, application.New(“owl”, “electricity”), to generate the tags.
The final parameter is a variadic set of options. Here I’m asking the reporter to log errors and capture standard Go runtime metrics.
The final thing we do is set a prefix on the reporter, owl.monitor. This helps organise and identify metrics in the Wavefront console. With this prefix, all our metrics will appear under the following hierarchy.
metrics
└── owl
    └── monitor
        ├── power
        ├── readings
        ├── battery
        └── runtime
            └── cpu
Add your custom metrics
With the sender and the reporter configured, we can now start adding metrics to our application.
Wavefront provides a client for the popular go-metrics package. Go-Metrics provides access to several metrics. We will use two of them:
- Counter — Shows values as they increase (and decrease).
- Gauge — Shows current value for each point in time.
The first metric we will add is a gauge that measures the current power consumption. We first create the metric and then register it to our Reporter, along with any tags we want to associate with the series.
tags := map[string]string{
	"type": "electricity",
}

guage := metrics.NewGauge()
err = reporter.RegisterMetric("power", guage, tags)
if err != nil {
	panic(err)
}
To update the gauge, we set its value whenever we receive a new power measurement.
guage.Update(elec.Chan[0].Power)
The electricity meter decides when it broadcasts readings on the network. The gap between readings varies and so I’d like to use another metric to capture the rate at which readings arrive.
	counter := metrics.NewCounter()
	err = reporter.RegisterMetric("measurement", counter, tags)
	if err != nil {
		panic(err)
	}
As before, we create the metric and then register it with our provider. We update the counter whenever we receive a new reading.
counter.Inc(1)
Following the approach outline above, I added custom metrics to show me:
- Battery Level
- RSSI - a measure of signal strength
- LQI - a measure of link quality
The complete code is available on GitHub (github.com/billglover/go-owl/). To make use of it, you’ll need an Owl Intuition Energy monitor. But I’m confident you can follow the approach I took and start to add metrics to your own applications. I’d be happy to help if you face challenges.
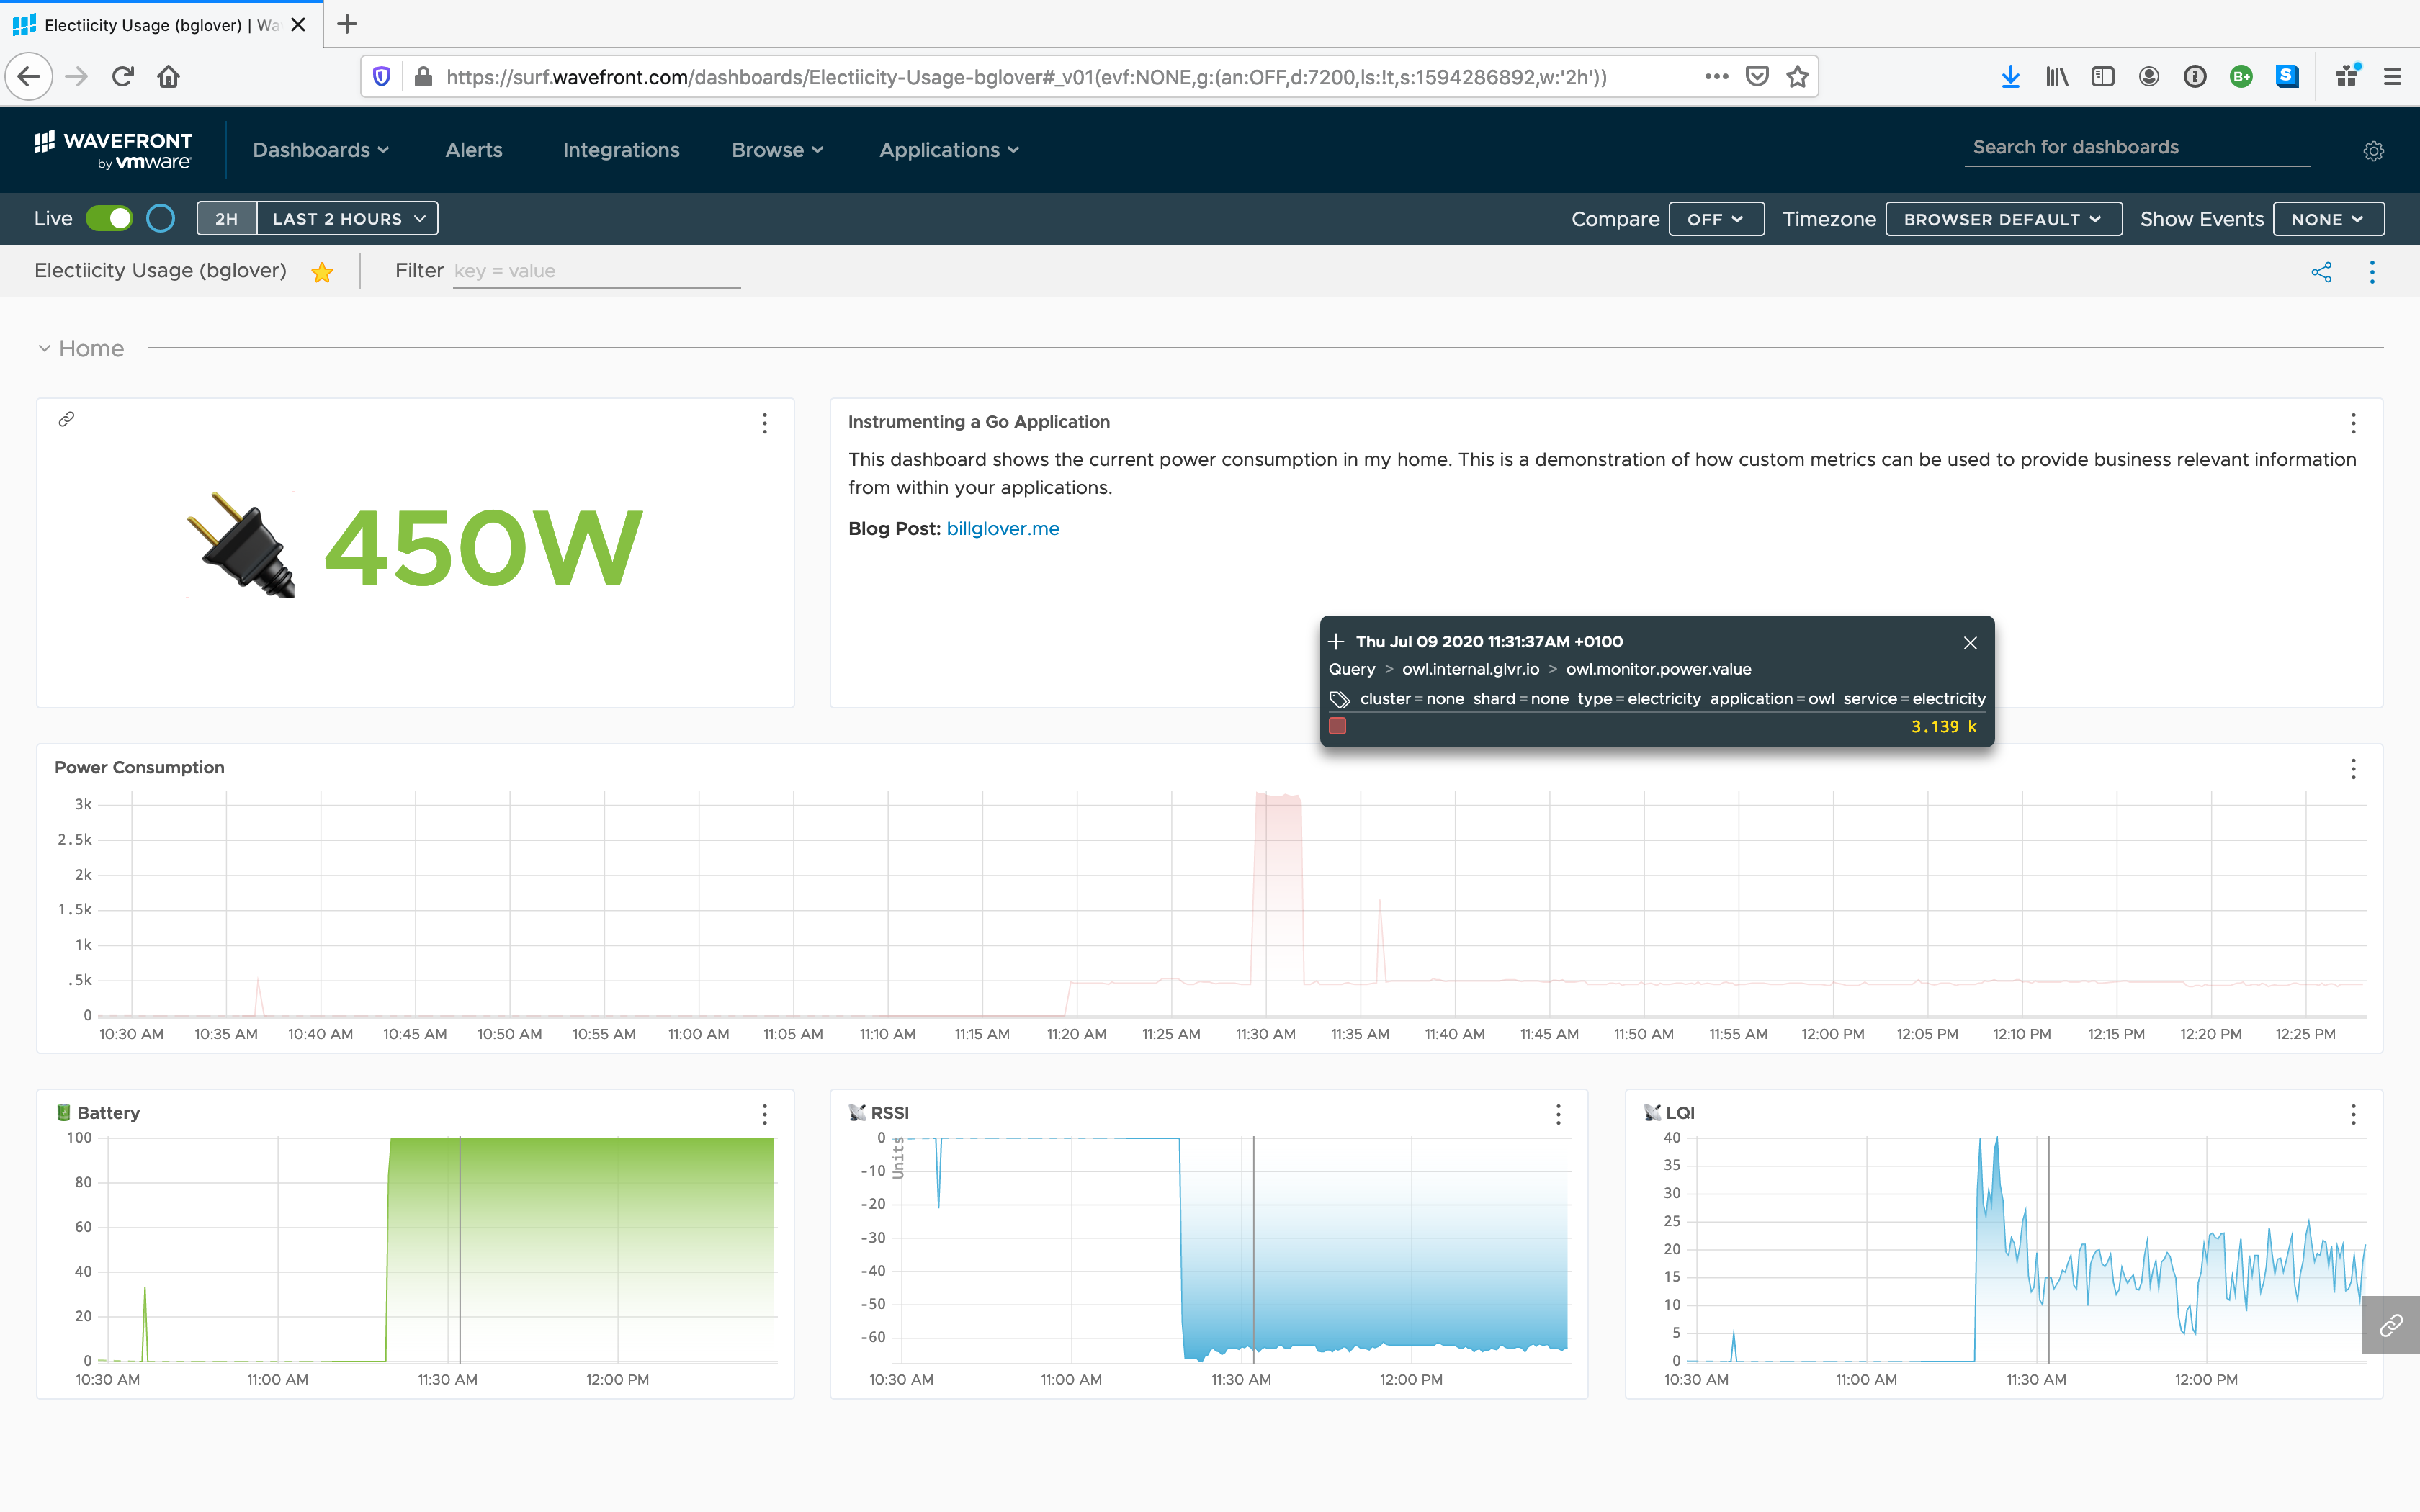
View Your Data
With metrics defined, you can now start querying data in Wavefront. This is the dashboard I pulled together from the metrics exposed in this application.
Video Walk Through
I recorded a walkthrough showing how I added metrics to my Go Owl application. It’s a little long (45 minutes) but shows everything I did to get the application up and running with an initial dashboard.
In Part 3, I will use Wavefront to add tracing to a Go application.
- Part 1: Logging & Metrics: It’s a Journey
- Part 2: Instrument Go applications with Wavefront (this post)
- Part 3: Add tracing to your Go application with Wavefront (coming soon)